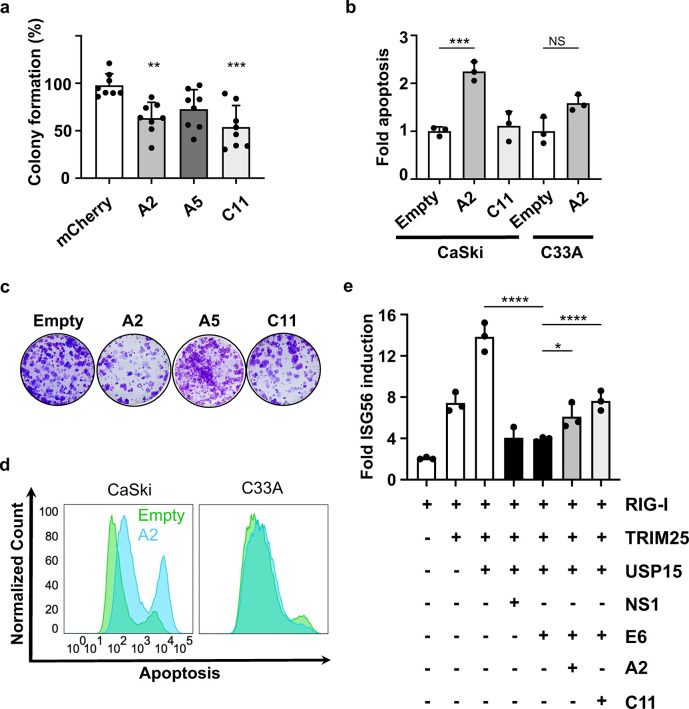
Figure 2. Nanobodies reduce colony-forming ability and induce apoptosis in HPV(+) cells.
(a) Clonogenic assay. Colonies were stained with crystal violet and counted by Image J software. Colony-forming units were normalized to the mCherry control well in each plate and statistically analyzed using a one-way ANOVA (N=8). (b) Annexin V-APC/PI analysis of apoptosis compared to Empty control. Apoptosis was analyzed using FlowJo and analyzed with GraphPad using a one-way ANOVA (N=3). Error bars represent ± SD. (c) Colony forming assay images. (d) Annexin-V-APC/PI histograms for CaSki and C33A cell lines transfected with Empty control and A2 nanobody. (e) Dual Luciferase activity for ISG56 transcription. Luciferase activities shown are the means ± SD of triplicate samples for one of three representative experiments (N=3). (* p < 0.0332, ** p < 0.0021, *** p < 0.0002, **** p < 0.0001).

