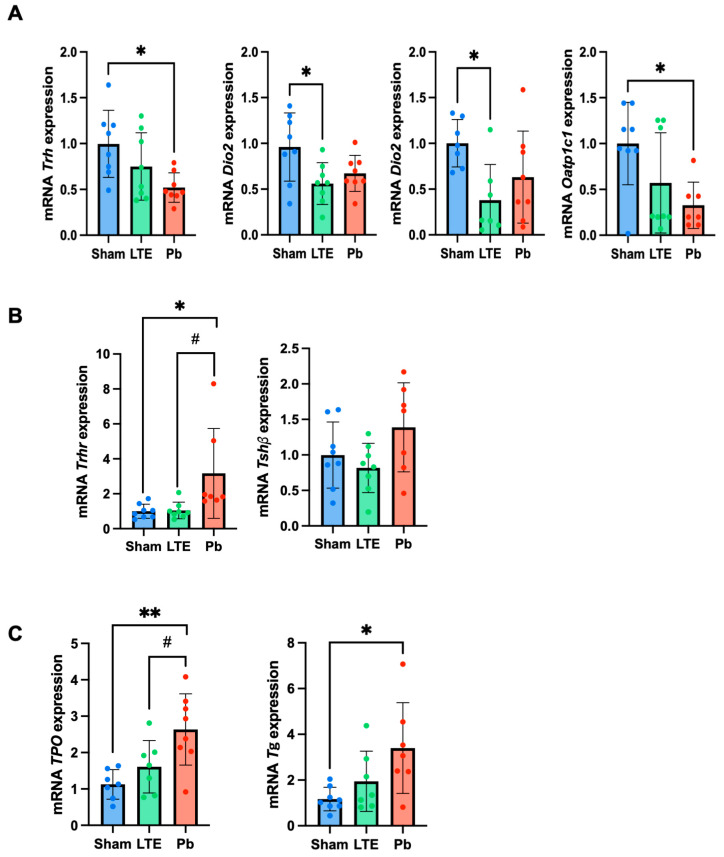
Figure 4.
RT-qPCR analysis of the thyroid hormone-regulating genes in the hypothalamic–pituitary–thyroid (HPT) axis. The relative mRNA expression levels of Trh, Dio2, Dio3, and Oatp1c1 in the hypothalamus (A); Trhr and Tshβ in the pituitary gland (B); and Tpo and Tg in the thyroid glands (C). The data are presented as mean ± standard deviation (n = 7–8). * p < 0.05 and ** p < 0.01 versus sham; # p < 0.05 versus LTE exposure.

