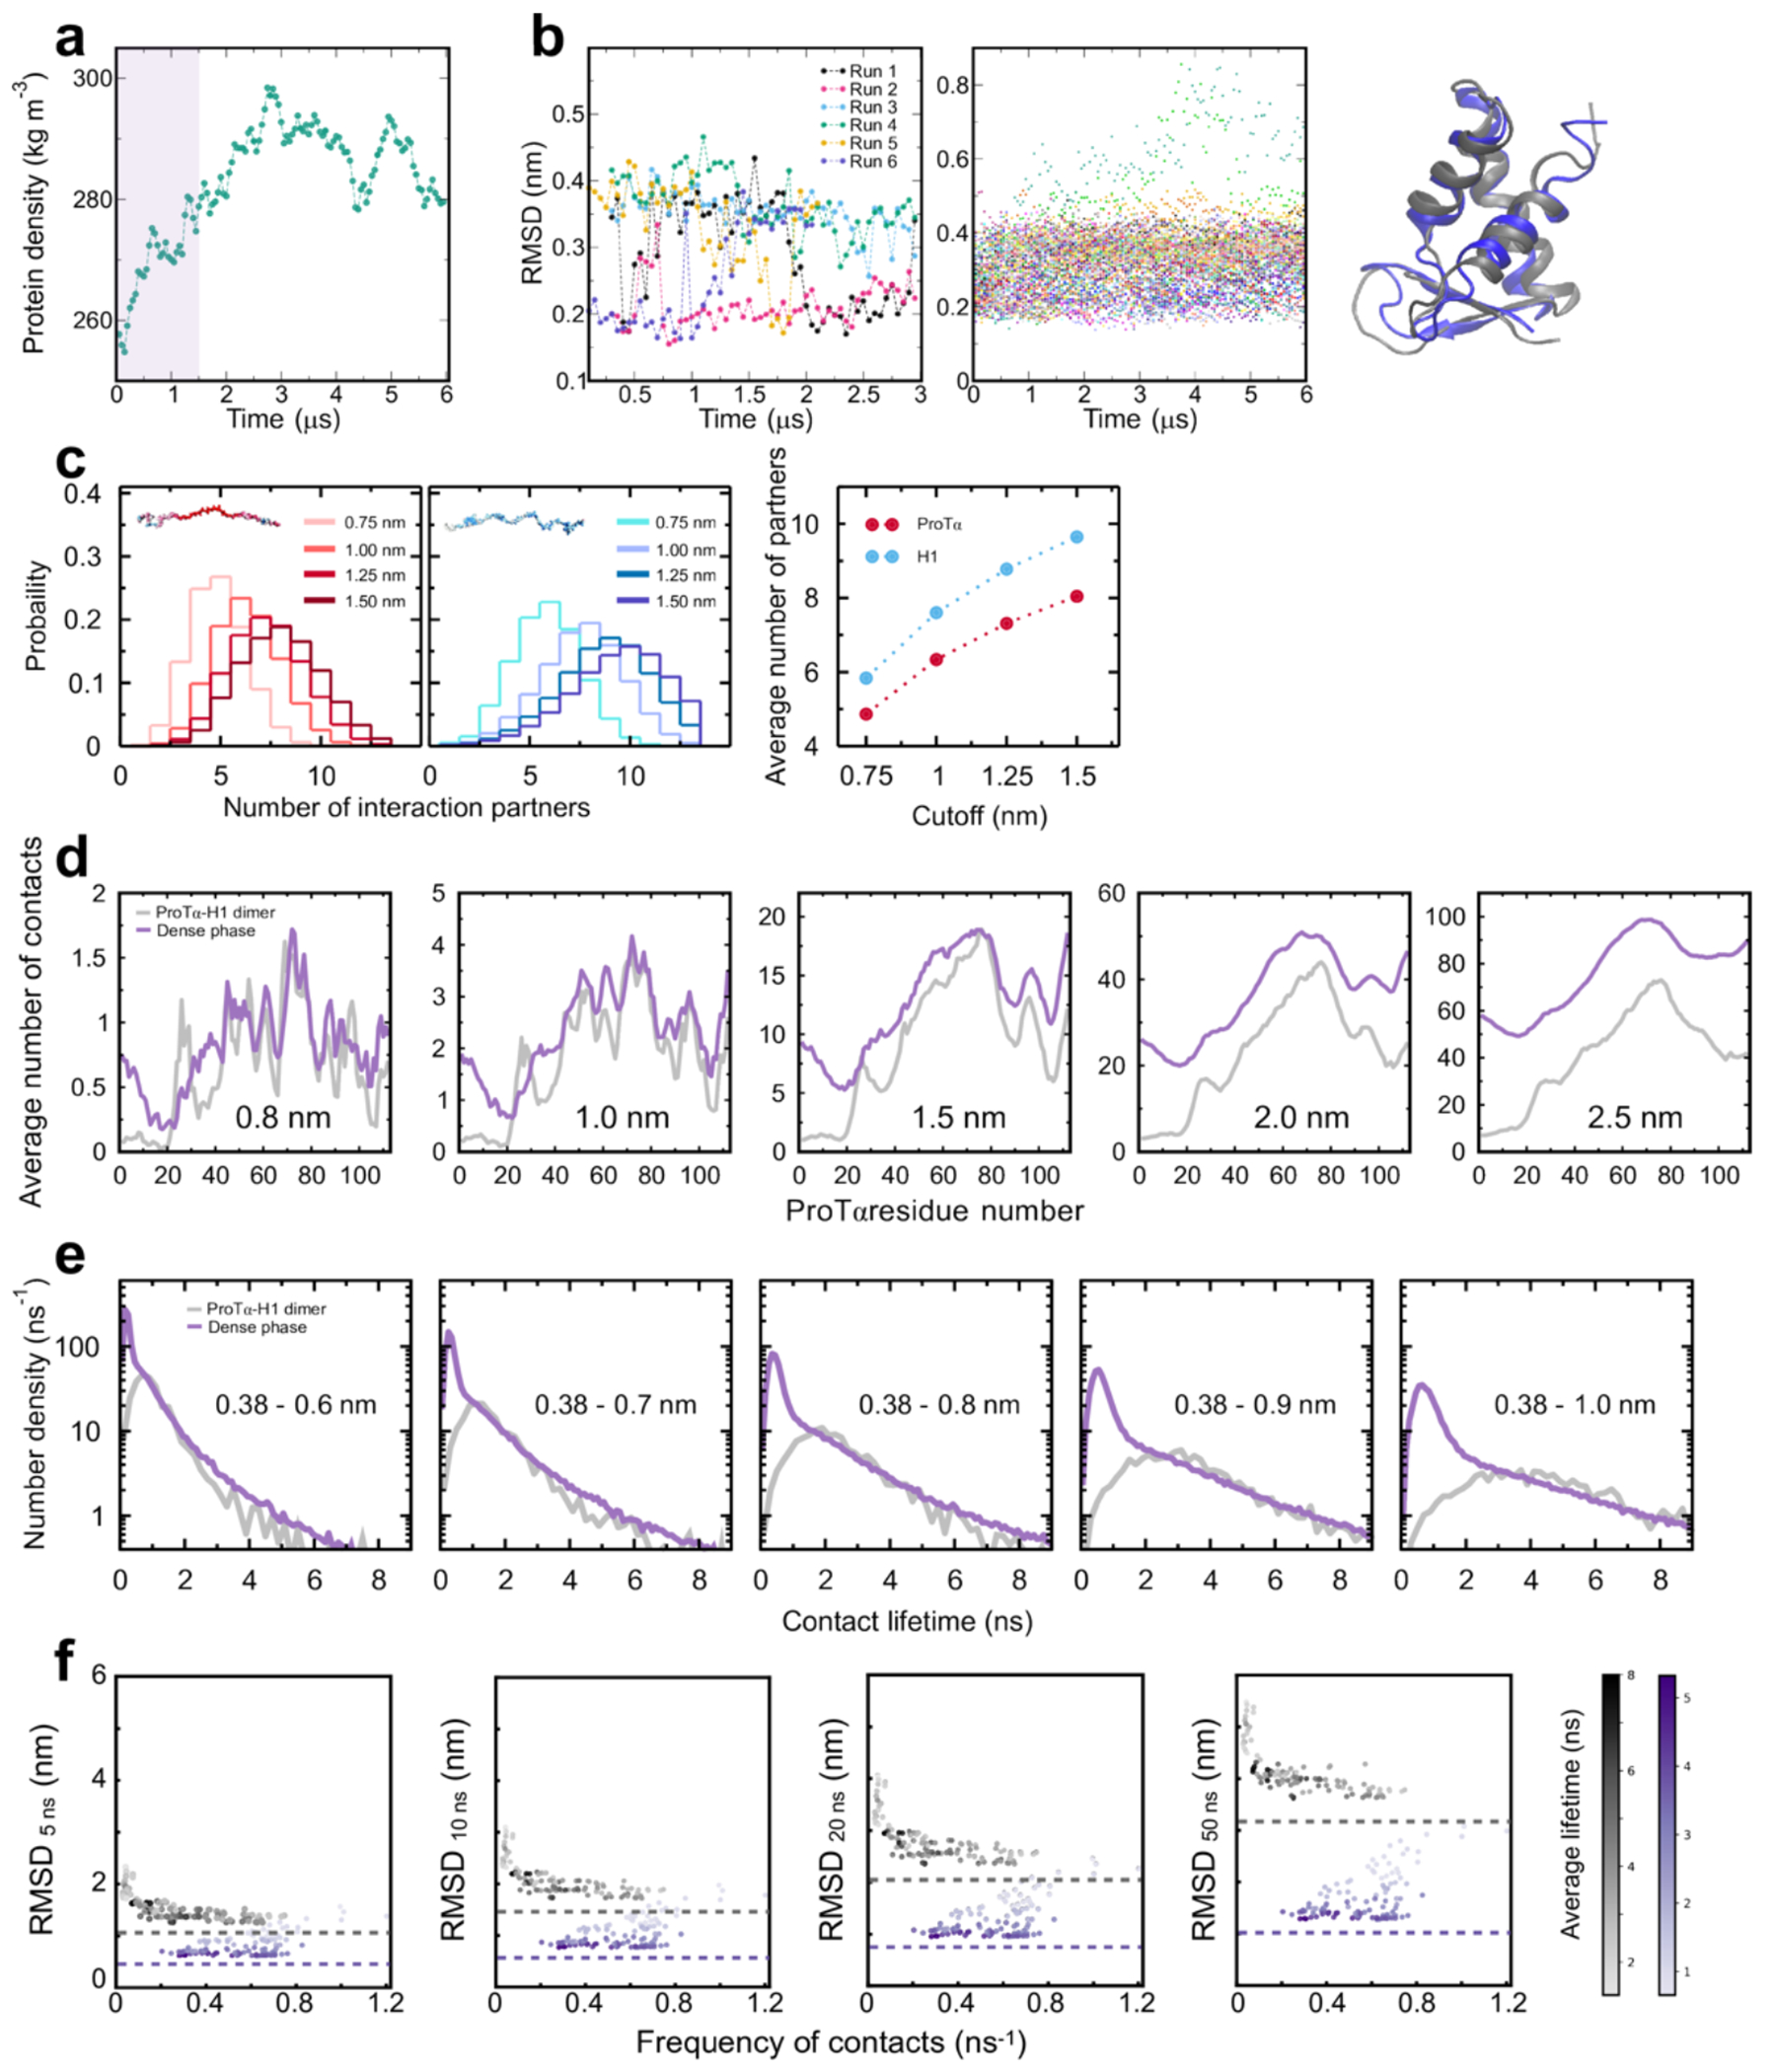
Extended Data Fig. 7. Equilibration of dense phase simulation, stability of H1 globular domain in simulations, and robustness to cutoff variation.

a. Protein density in the central part of the slab simulation as a function of time, calculated in 50-ns blocks. The first 1.5 μs of the simulation (shaded band) were treated as equilibration and omitted from further analysis. b. Stability of the H1 globular domains (GDs), quantified as the backbone RMSD between simulated and experimental structure (PDB 6HQ1)(Martinsen et al. 2022), over the course of dimer (left) and dense-phase simulations (middle). The fraction of partially unfolded domains (< 10% with RMSD > 0.4 nm) is in line with the experimental stability previously determined in dilute solution(Martinsen et al. 2022). Note that the backbone RMSD of 0.2-0.4 nm for the folded domain can be attributed to the flexibility of the loops in the structure, illustrated by superposition of two structures with RMSD = 0.4 nm (right). c. Histograms of the number of H1 chains simultaneously interacting with a single ProTα chain (left) and vice versa (middle) using different distance cutoffs (see legend; 1.0 nm(Abraham et al. 2015) was used in Fig. 3c). Note that the number of ProTα chains interacting with a single H1 chain is always ~1.2 times the number of H1 chains interacting with a single ProTα chain, as expected from charge balance (Extended Data Fig. 1a). d. Average number of contacts that each residue of ProTα makes in the heterodimer with H1 (gray) and in the dense phase (purple) with different distance cutoffs (1.0 nm — approximately the Bjerrum length — was used in the Fig. 3e). As expected, the increase of the number of contacts with the cutoff is more pronounced in the dense phase than in the dimer, reflecting the higher protein density in the condensate. Owing to the computational costs of the distance calculations for each residue (10,752 distances in total), only 500 ns of the dense-phase trajectory (2.0 to 2.5 μs) were used for cutoff variation (in contrast to Fig. 3e, where the complete trajectory was used). e. Distribution of the lifetimes of contacts formed by ProTα residues in the dimer (gray) and in the dense phase (purple) using different upper bounds for the contact definition (see Methods; 0.8 nm(Best, Hummer, and Eaton 2013) was used in Fig. 3f). Owing to the computational costs of the lifetime calculations, only 500 ns of the dense-phase trajectory (1.5 to 2.0 μs) and only one dimer simulation was used for cutoff variation (in contrast to Fig. 3f, where the complete trajectory was used). While the increased cutoff leads to a slight increase in the absolute value of the lifetimes, the reported trends are consistent: the distributions of longer-lived contacts are very similar for the dimer and dense-phase simulations, and the number of short-lived contacts is larger in the dense phase. f. Root-mean-square displacement (RMSD) of the 112 individual ProTα residues with different contact lifetimes (see legend) vs their average frequency of contact formation.
