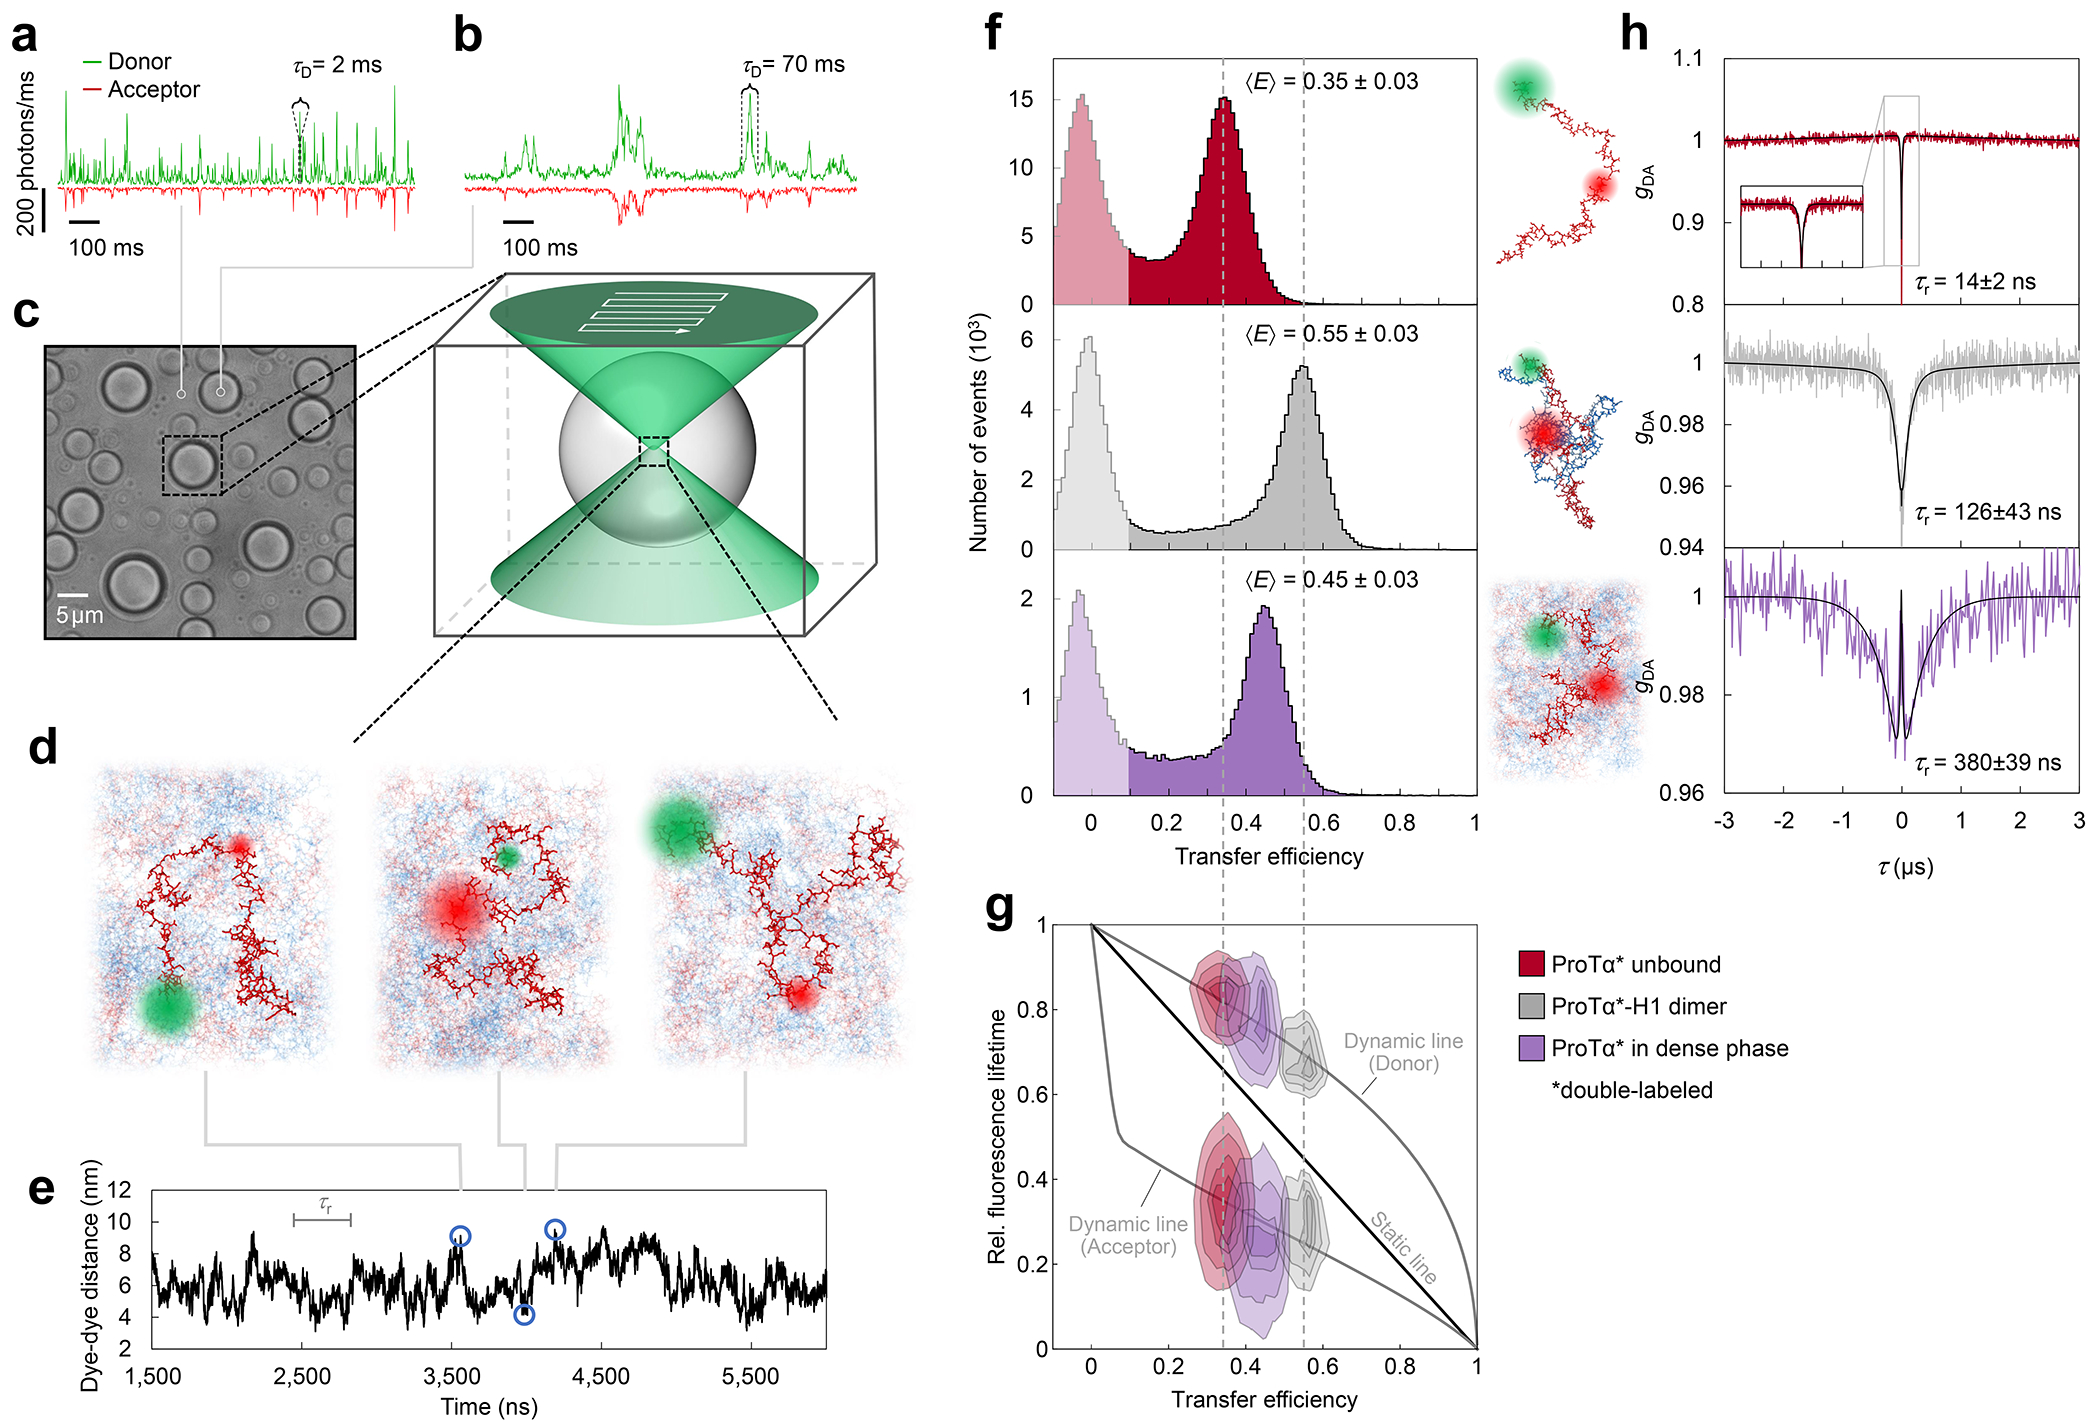
Fig. 2. Single-molecule spectroscopy in the dilute and dense phases.

a, Photon time traces in the dilute phase (100 μW laser power) and b, in the ProTα-H1 droplets (30 μW laser power in scanning mode, see c) doped with picomolar concentrations of double-labeled ProTα. c, Single-molecule measurements were performed by positioning the confocal volume in the dilute phase or inside droplets that are stationary at the bottom of the sample chamber. d, Configurations of double-labeled ProTα (red) in the dense phase rapidly sampling different dye-dye distances, with FRET efficiency-dependent fluorescence illustrated in red and green along with a molecular trajectory from MD simulations (e). The scale bar indicates the magnitude of the reconfiguration time, τr, in the dense phase. f, Single-molecule transfer efficiency histograms of ProTαC (ProTα labeled at positions 56 and 110) as a monomer in solution (top), in the heterodimer with H1 (middle), and within droplets (bottom, continuous-wave excitation with scanning, see c). Uncertainties represent the accuracy due to instrument calibration (see Methods). g, 2D histograms of relative donor and acceptor fluorescence lifetimes versus transfer efficiency(Schuler et al. 2016) for all detected bursts (pulsed excitation). The straight line shows the dependence for fluorophores at a fixed distance; curved lines show the dependences for broad distance distributions (self-avoiding walk polymer(Zheng et al. 2018), see Methods; upper line: donor lifetime; lower line: acceptor lifetime). h, Nanosecond fluorescence correlation spectroscopy probing chain dynamics in double-labeled ProTαC free (top), in the ProTα-H1 dimer (middle), and in the dense phase (bottom); data are donor–acceptor fluorescence cross-correlations with fits (black lines, see Extended Data Fig. 5) normalized to 1 at their respective values at 3 μs to facilitate direct comparison. Resulting reconfiguration times, τr, are averages of three independent measurements (fits and uncertainties discussed in Methods). All measurements were performed in TEK buffer at 120 mM KCl (ionic strength 128 mM).
