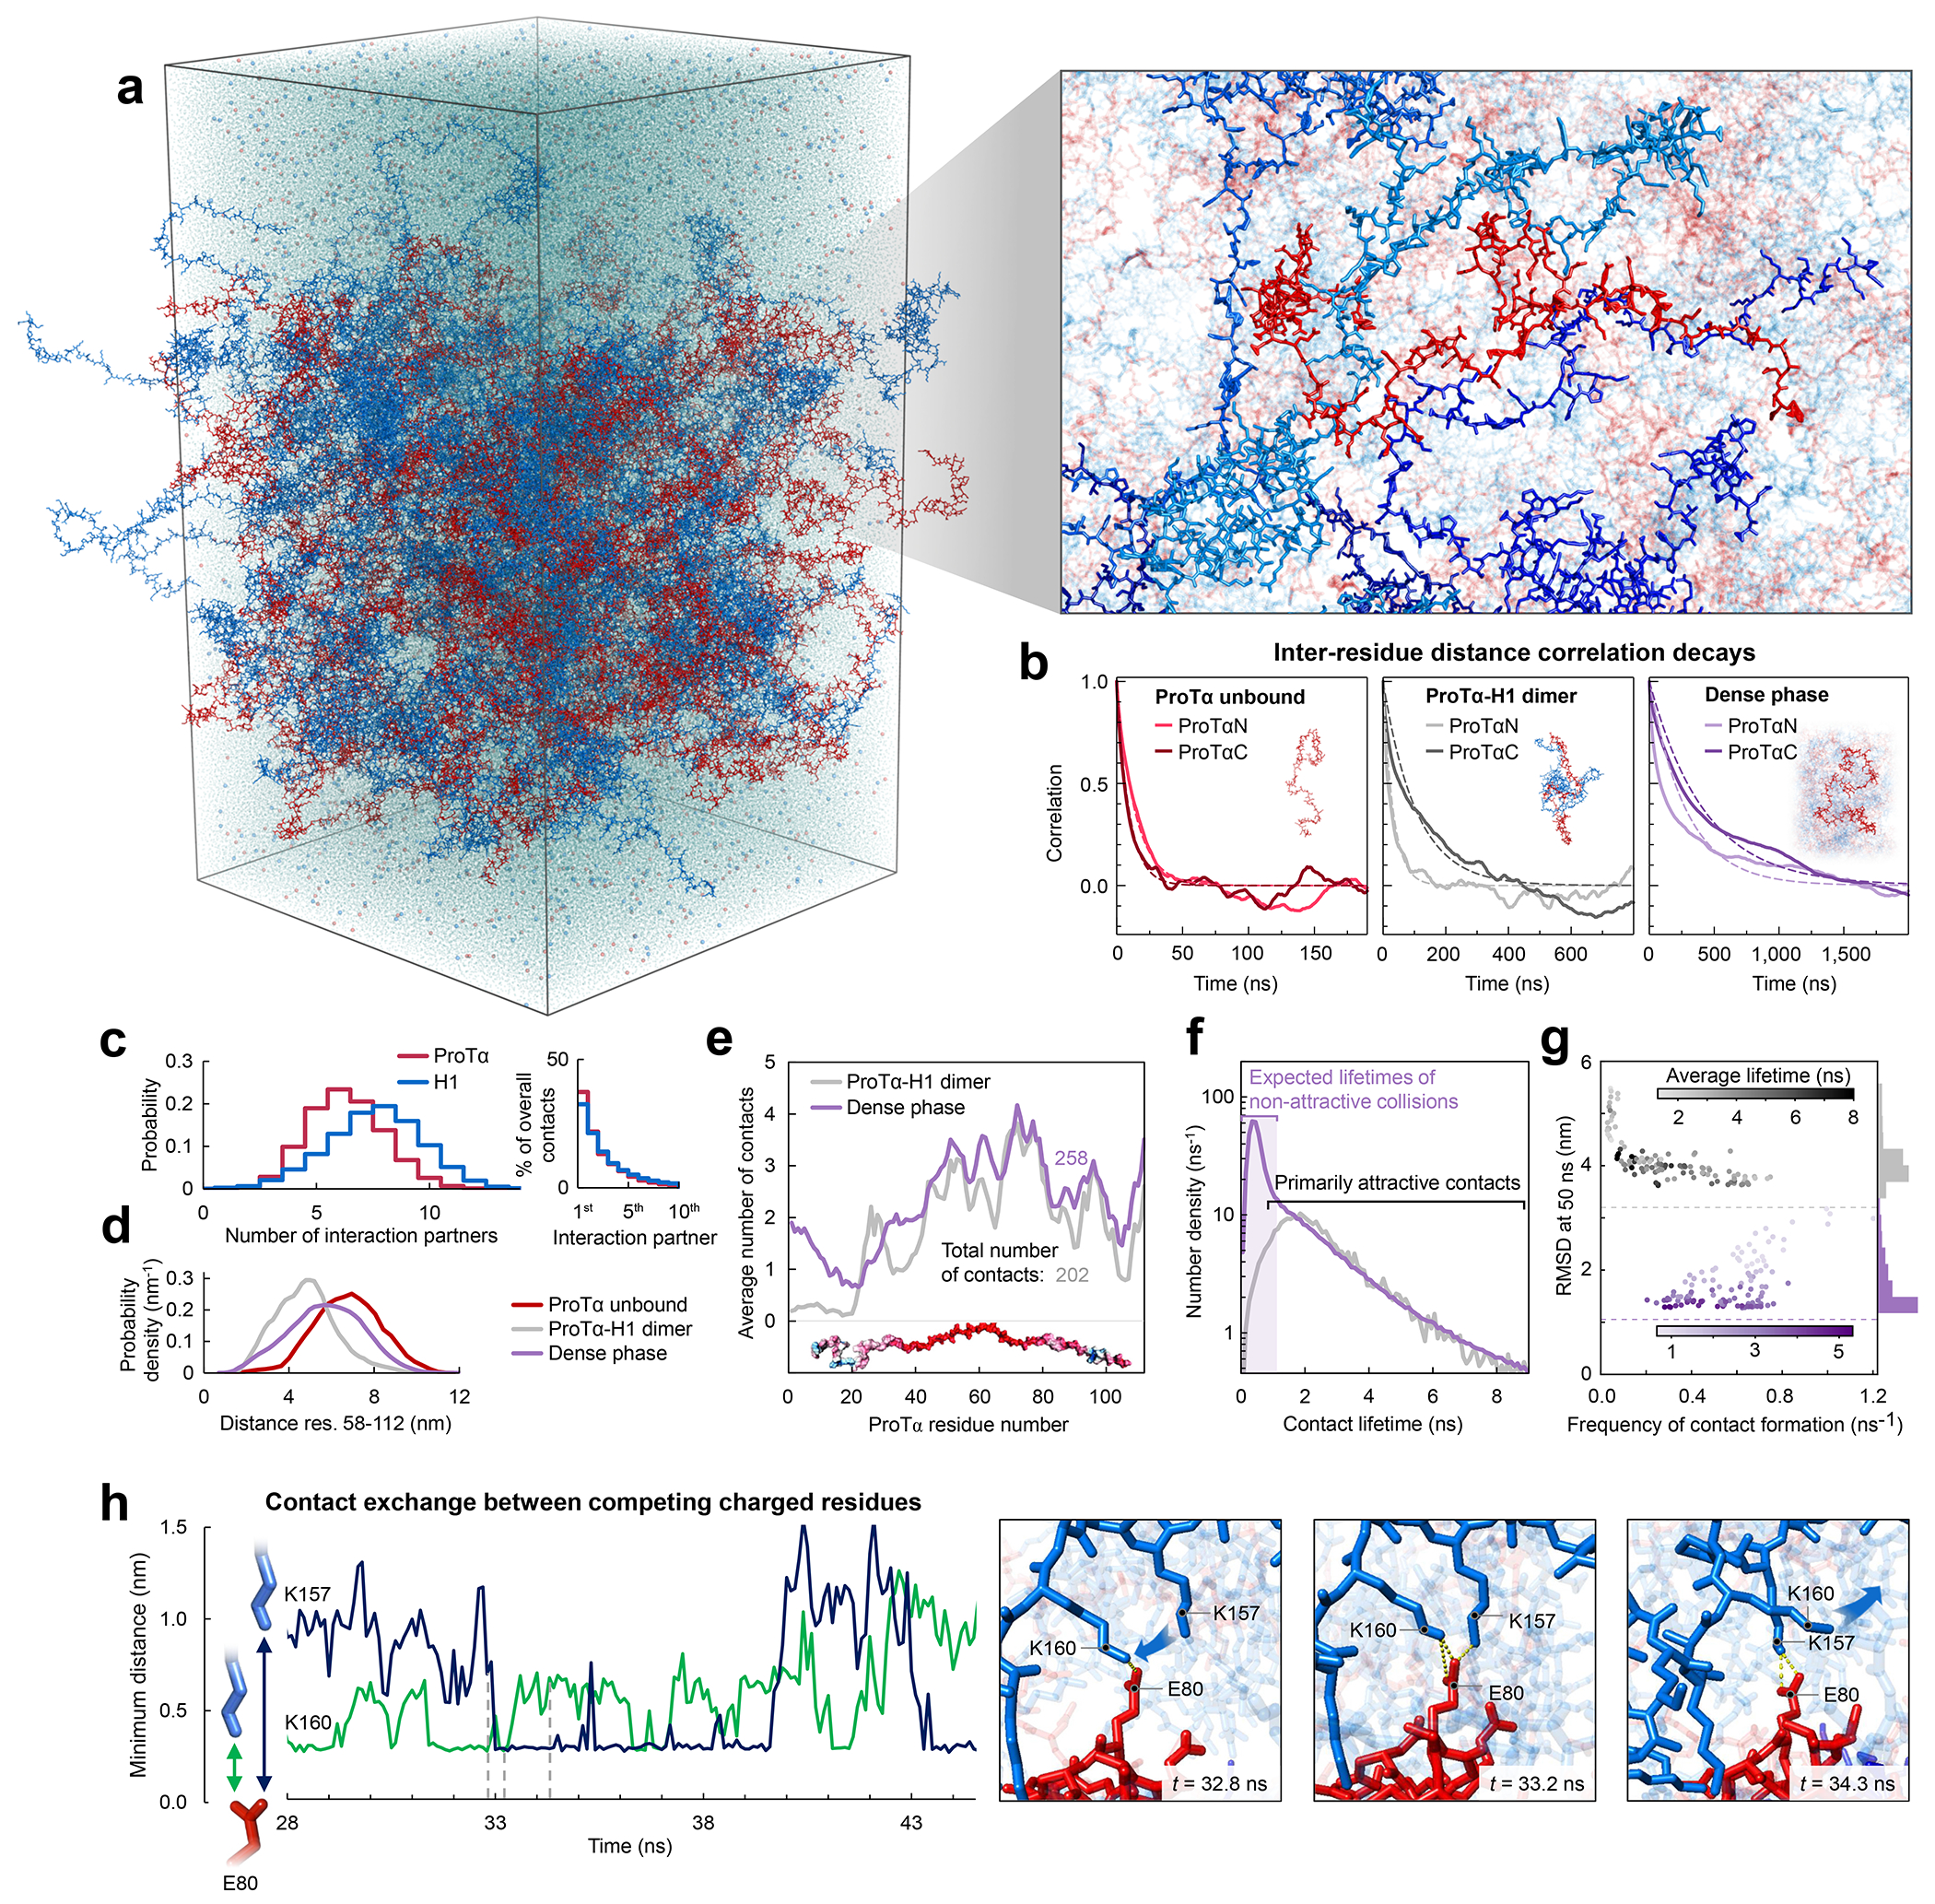
Fig. 3. Large-scale molecular dynamics simulations of ProTα-H1 phase separation.

a, All-atom explicit solvent simulation of 96 ProTα (red) and 80 H1 molecules (blue) in slab geometry(Zheng et al. 2020), including water (light blue spheres), K+ ions (blue spheres), and Cl− ions (red spheres). The zoom-in highlights a ProTα molecule (red) and four H1 interaction partners (shades of blue, see Supplementary Videos 1–3). b, Time correlation functions of the distance between residues 5 and 58 (ProTαN) and residues 58 and 112 (ProTαC) from simulations of ProTα unbound (left), in the heterodimer (middle), and in the dense phase (right), with single-exponential fits (dashed lines). c, Histograms of the number of H1 molecules simultaneously interacting with a single ProTα (red) and vice versa (blue). Right: Contributions of each interaction partner to the total number of residue-residue contacts. d, Distance distributions between ProTα residues 58 and 112 in the different conditions (see legend). e, Average number of contacts each residue of ProTα makes in the dimer (gray) and dense phase (purple), with the average total number of contacts indicated. Only ~11% of all ProTα contacts in the dense phase are with other ProTα chains. f, Distribution of the lifetimes of contacts made by ProTα in the heterodimer (gray) and the dense phase (purple). Areas under the curves correspond to the total number of new contacts formed per chain in one nanosecond. Shaded band: contact lifetimes expected for non-attractive collisions (see Extended Data Fig. 9a,b). g, Root-mean-square displacement (RMSD) of the 112 individual ProTα residues within 50 ns vs their average frequency of contact formation (color scales: average contact lifetimes; horizontal dashed lines: average RMSD at 50 ns for the center of mass of ProTα in the dimer (gray) and dense phase (purple), a lower bound for the RMSD of the individual residues; numbers of residues with similar RMSD histogrammed on the right). h, Example of rapid exchange between salt bridges in the dense phase, illustrated by two time trajectories of the minimum distance between the residue pairs involved (left) and corresponding snapshots from the simulation (right) (see Supplementary Video 3).
