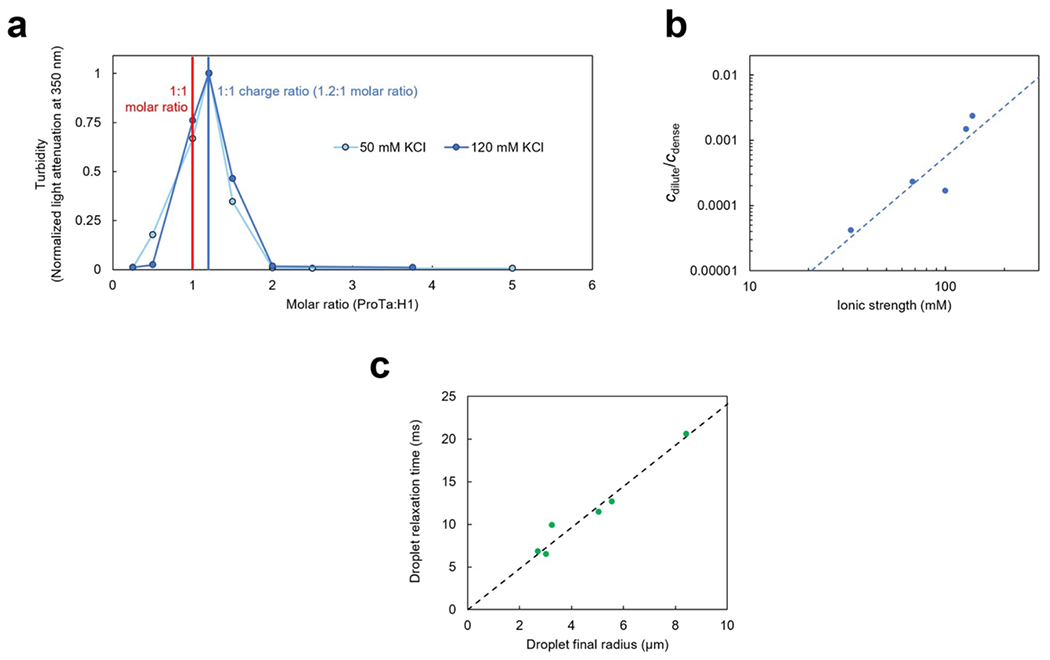
Extended Data Fig. 1. Dependence of phase separation on solution conditions and droplet fusion dynamics.

a. Phase separation is most pronounced in a charged-balanced mixture of H1 and ProTα. The extent of droplet formation was assessed using turbidity at 350 nm in TEK buffer with 50 mM KCl and at 120 mM KCl at a constant concentration of H1 (10 μM and 20 μM, at 50 mM and 120 mM KCl, respectively) and varying amounts of ProTα. At both salt concentrations, maximum phase separation was observed at a stoichiometric ratio of 1.2:1 for ProTα:H1, where the charges of the two proteins balance. b. Lohman-Record plot(Record, Anderson, and Lohman 1978) of the ionic strength dependence of the dilute (cdilute) over dense-phase protein concentration (cdense). If we treat the ratio cdilute/cdense as an effective equilibrium constant for the partitioning of H1 and ProTα between the dilute and dense phases, its logarithm approximates the free energy difference between the heterodimer in the dilute phase (Extended Data Fig. 2) and in the dense phase. The slope of a graph of these values versus the logarithm of the ionic strength (or salt concentration) can then be interpreted in terms of the number of ions released(Record, Anderson, and Lohman 1978) upon the transfer of a ProTα-H1 dimer into the dense phase (since Log(cdilute/cdense) diverges close to the critical point, we only included data points up to 120 mM KCl). The resulting value of 2.5±0.7 ions (uncertainty from error of the fit) is small compared to the ~18 ions released upon ProTα-H1 dimerization(Borgia et al. 2018; Sottini et al. 2020), in accord with the small number of additional charge-charge interactions of ProTα in the dense phase compared to the heterodimer obtained from the simulations (Fig. 3e). Note that cdilute = 35±5 μM at an ionic strength of 165 mM, which explains why no phase separation was observed in the NMR experiments of ProTα and H1 reported previously(Borgia et al. 2018). Even at the highest protein concentrations used there, the signal is expected to be dominated by the dilute phase, and in case droplets did form, their volume fraction was presumably too small to be apparent by eye. We chose to work at an ionic strength of 128 mM in the present work as a compromise between physiologically relevant salt concentrations and experimental feasibility, especially regarding sample consumption. c. The droplet relaxation time upon droplet fusion (measured in dual-trap optical tweezers(Alshareedah, Kaur, and Banerjee 2021), see Fig. 1c) is proportional to the radius of the final droplet, which indicates that the viscoelasticity of the dense phase on the millisecond timescale is dominated by the viscous (rather than the elastic) component(Alshareedah, Kaur, and Banerjee 2021). In this case, the slope of the fit (dashed line) is(Leal 2007; Jeon et al. 2018) , where is the ratio of macroscopic (or bulk) viscosity in the droplet over the solvent viscosity (ηs = 0.001 Pa s), and σ is the interfacial tension. With the resulting value of 2.4·103 s/m for the slope and ηm = 0.3 Pa s, we estimate σ ≈ 1.2·10−4 N/m.
