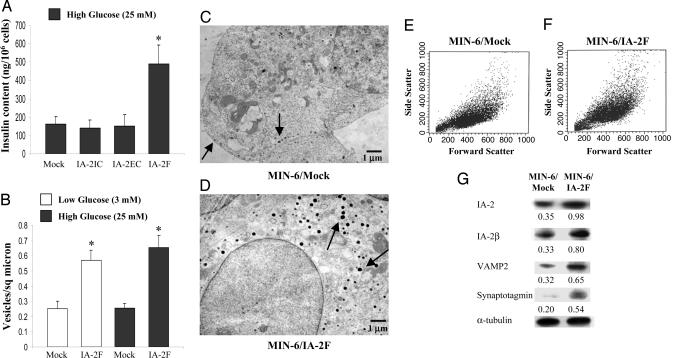
Fig. 3.
Insulin content and vesicle number in MIN-6 cells. (A) The insulin content as determined by ELISA in MIN-6 mock-, IA-2IC-, IA-2EC-, and IA-2F-transfected cells. Mean ± SEM of three separate experiments (*, P < 0.01). (B) Vesicles per square μm as determined by EM in mock- and IA-2F-transfected MIN-6 cells. Mean ± SEM of 18 fields (*, P < 0.01). (C and D) EM pictures: arrows point to insulin-containing vesicles. (E and F) FACS analysis: cell size as evaluated by forward scatter of mock-transfected (E) and IA-2F-transfected (F) MIN-6 cells. (G) Expression of integral (IA-2, IA-2β, VAMP2, and synaptotagmin) vesicle proteins.

