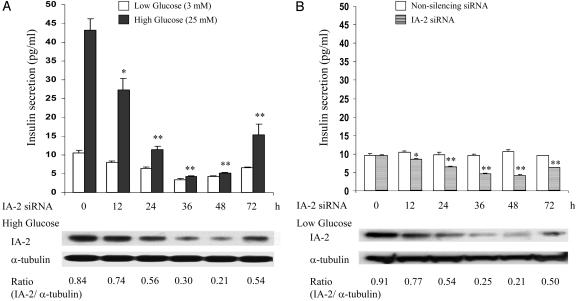
Fig. 6.
Treatment of MIN-6 cells (nontransfected) with IA-2 siRNA. (A) Cells treated with IA-2 siRNA were stimulated with low (3 mM) or high (25 mM) glucose, and insulin secretion was measured. IA-2 and α-tubulin expression, determined by Western blot, in cells treated with high glucose is shown. (B) Cells kept at a low concentration of glucose (3 mM) were treated with IA-2 siRNA or nonsilencing siRNA, and insulin secretion was measured. IA-2 and α-tubulin expression, determined by Western blot, in cells treated with IA-2 siRNA is shown. Mean ± SEM of three separate experiments. *, P < 0.05; **, P < 0.01.

