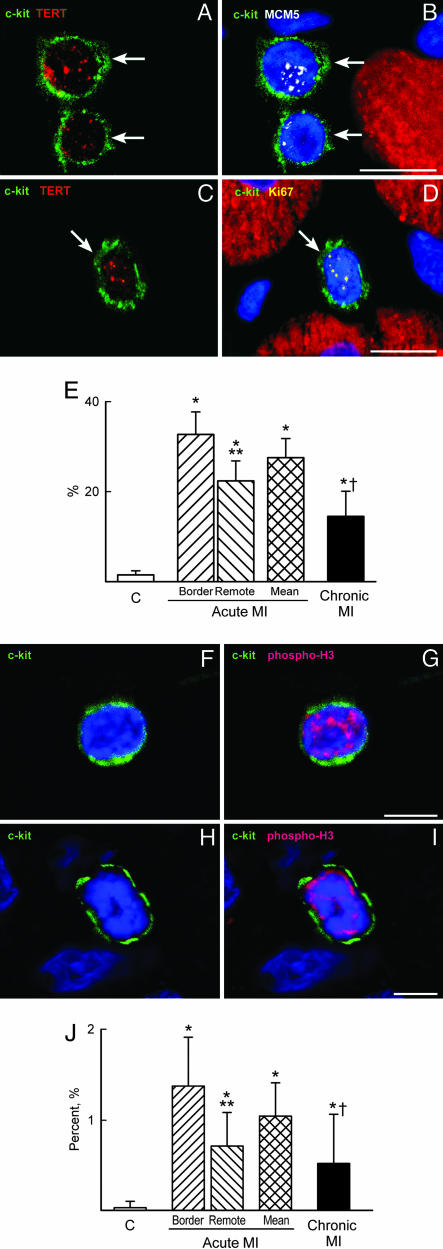
Fig. 3.
Heart failure and CSC growth. (A-D) c-kit-positive CSCs (green, arrows) express telomerase (red dots, A and C) and MCM5 (white dots, B) or Ki67 (yellow dots, D). Myocytes are labeled by α-sarcomeric actin (red) and nuclei by DAPI (blue). (E) Percentage of telomerase competent CSCs in the cell cycle. (F-I) c-kit-positive CSCs (green) have nuclei labeled by phospho-H3 (red). (J) Mitotic index of CSCs. *, P < 0.05 vs. controls (C); **, P < 0.05 between the border and remote myocardium in acute MI; †, P < 0.05 between acute and chronic MI. A, B, and F-I are acute infarcts. (Scale bars: 10 μm.)

