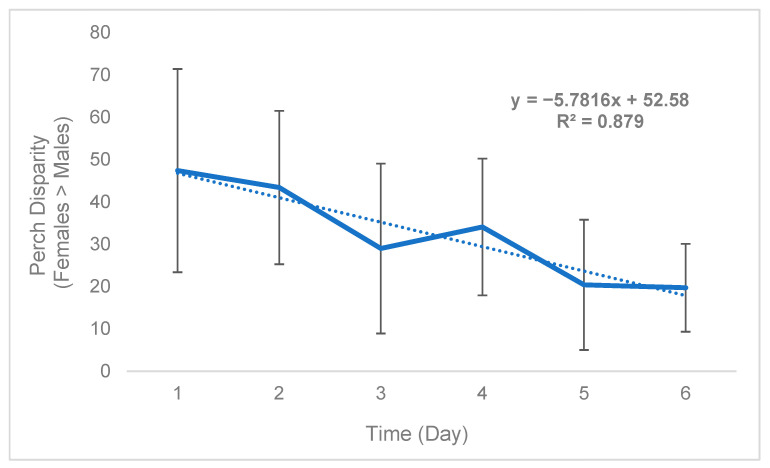
Figure 2.
Black soldier fly mean daily perch disparity over time (Trial 1). Perch disparity was calculated as the sum of females perching minus the sum of males perching. Error bars indicate ±SD. The best-fit line is a linear regression. The experimental unit was a 0.93 m3 mating cage (n = 4 treatments, n = 3 replicates) held within an indoor rearing environment in Texas, USA. Each cage had an initial population of 90 males and 90 females.

