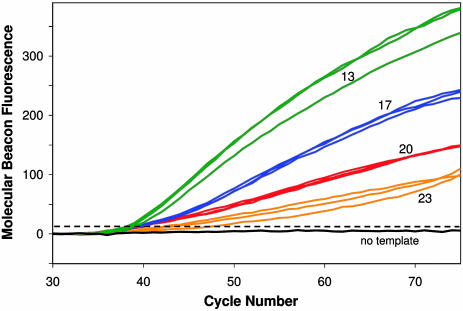
Fig. 3.
Detection of CFTR-specific product during the linear amplification phase of LATE-PCR. Curves show increases in molecular beacon fluorescence in individual samples with TmA - TmX values of 13 (green), 17 (blue), 20 (red), or 23 (orange). Starting template was 600 pg of human genomic DNA in each sample.

