Fig. 4.
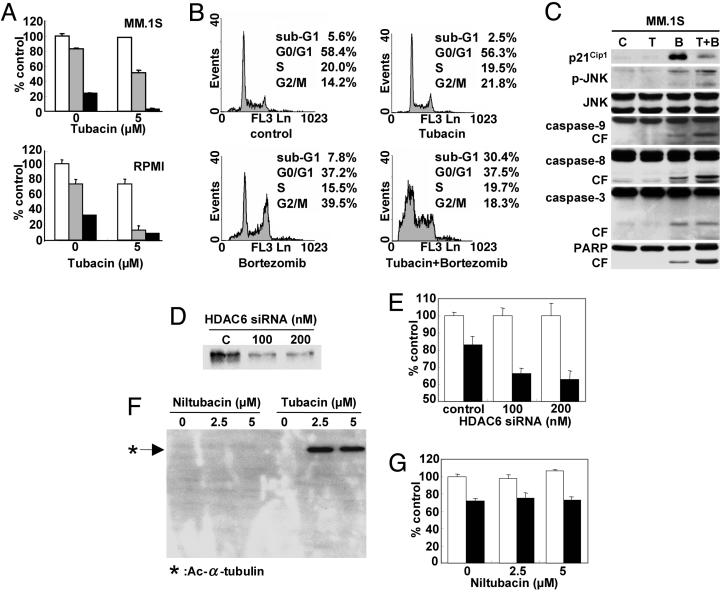
Tubacin and bortezomib induce synergistic antitumor activity in MM cell lines. (A) MM.1S and RPMI8226 MM cells were cultured for 24 h in the presence or absence of tubacin (5 μM) in control media (white bars) and with 5 nM (gray bars) or 10 nM (black bars) bortezomib; cytotoxicity was assessed by MTT assay. (B) MM.1S cells were cultured for 24 h in the presence or absence of tubacin (5 μM) and/or bortezomib (5 nM); cell cycle profile was assessed by flow cytometry using propidium iodine staining. (C) MM.1S cells were cultured for 24 h in the presence or absence of tubacin (T: 5 μM) and/or bortezomib (B: 5 nM); whole-cell lysates were subjected to Western blotting with anti-p21Cip1, p-JNK (stress-activated protein kinase), JNK, caspase-9, caspase-8, caspase-3, and PARP Abs. MM.1S cells were transiently transfected with HDAC6 siRNA. (D and E) Cells were then subjected to Western blotting using anti-HDAC6 Ab (D) or MTT assay (E), in the presence or absence of 5 nM bortezomib (filled bars). MM.1S cells were cultured for 24 h with niltubacin (2.5 and 5 μM) or tubacin (2.5 and 5 μM). (F and G) Cells were then subjected to Western blotting using Ac-Lys Ab (F) or MTT assay (G), in the presence or absence of 5 nM bortezomib (filled bars). Data represent mean (±SD) of quadruplicate cultures.

