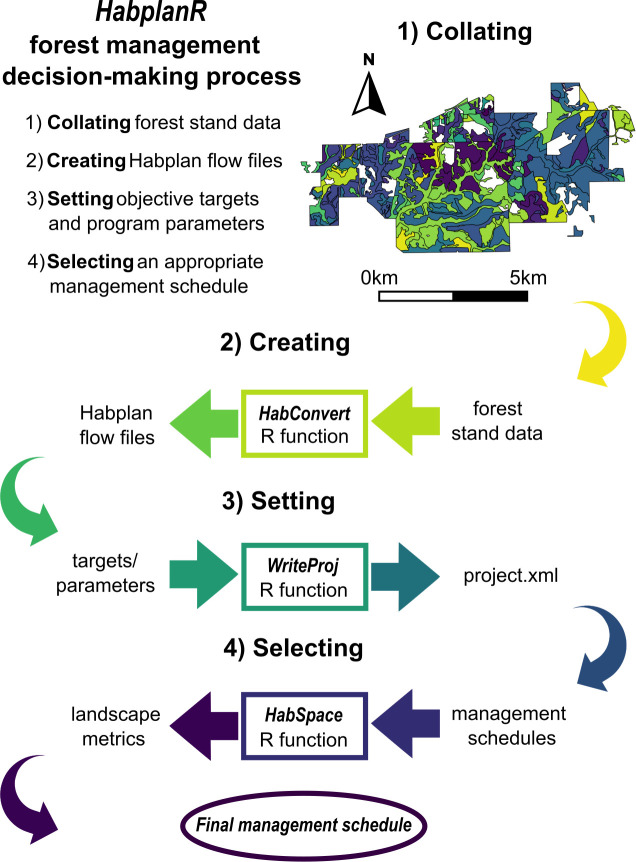
Fig 1. Flow diagram of forest management decision-making process using Habplan and HabplanR.
Bold text numbered 1–4 represent the four main steps of the forest management decision-making process. Colored rectangles depict when a specific HabplanR function is run during the process, and text before inward-facing arrows show R function inputs, and text after outward-facing arrows represent R function outputs. Colors in the provided map highlight stand boundaries.

