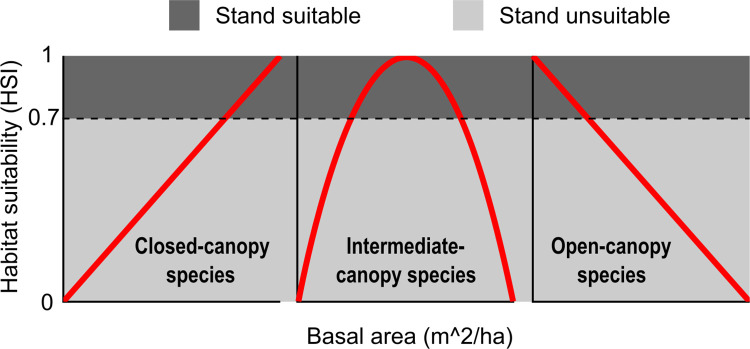
Fig 3. Representations of three species “types” with divergent habitat requirements.
Red line demonstrates relationship between basal area and habitat. Black dashed line depicts Habitat Suitability Index (HSI) threshold of 0.7 used to determine if a stand hosted habitat or non-habitat (can be altered for each species, see Step 2). Left: Closed-canopy-associated species; Middle: intermediate-canopy-associated species; Right: Open-canopy-associated species.

