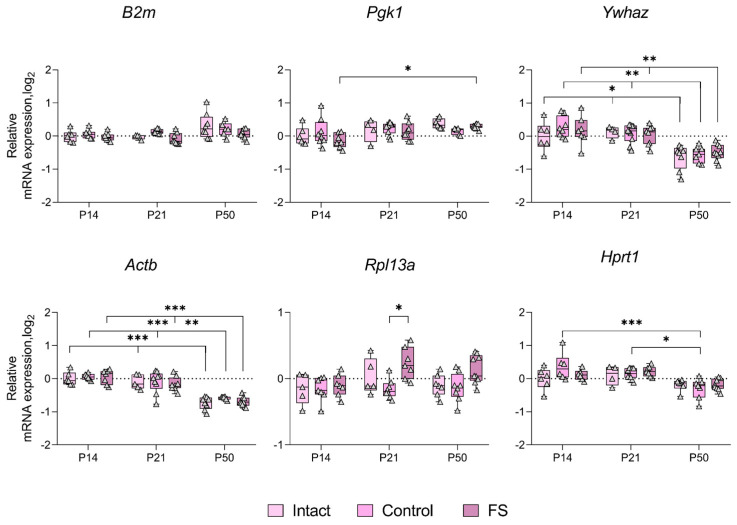
Figure 4.
Expression dynamics of unstable genes in the rat ventral hippocampus in a febrile seizure model at postnatal days 14, 21, 50 (P14, P21, and P50). The Ppia and Gapdh genes were used to data normalization. Intact: intact group; Control: control group; FS: experimental group. *, **, ***—p < 0.05, p < 0.01 or p < 0.001, respectively (two-way ANOVA followed by Sidak post hoc test). The results are presented in the form of boxes, which include the median, the first and third quartiles, and individual values (triangles) with minimum and maximum values.

