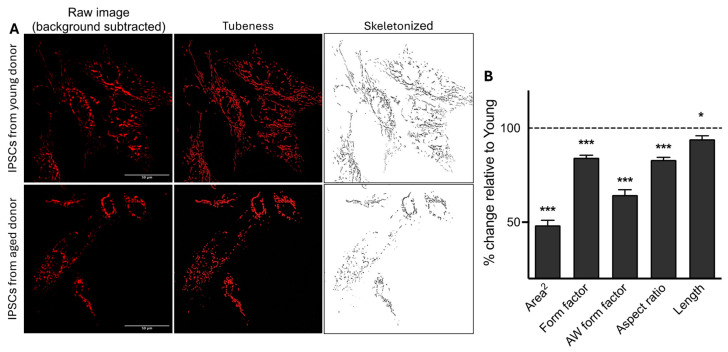
Figure 3.
Impact of age on the mitochondrial network morphology in iPSCs. (A) Representative z-projection microscopy images of the mitochondrial network stained with the CMXROS Mitotracker Red in iPSCs from young and aged donors (×94.5 magnification). The left panels display the raw images after background subtraction (rolling ball radius = 20 pixels). The middle panels (tubeness) display the same pictures after processing the morphometry macro on the FIJI software. The right panels (skeletonized) present binary images of the mitochondrial network (in black) after further image processing in FIJI using the “skeletonize” function. (B) Quantification of mitochondrial network morphology parameters, including the area2 (average of the size of mitochondria), form factor (elongation of mitochondria), area-weighted (AW) form factor (a variant of form factor with a bias towards larger mitochondria), aspect ratio (branching), and mitochondria length in iPSCs from young and aged donors. Values represent the mean ± SEM of three independent experiments (n = 85–90 replicates per condition, four human iPSCs from young donors or four human iPSCs from aged donord per group), and are shown as the percentage of iPSCs derived from young donors (dashed line). * p < 0.05, *** p < 0.001, Student t-test iPSCs from young donors vs. iPSCs from aged donors.

