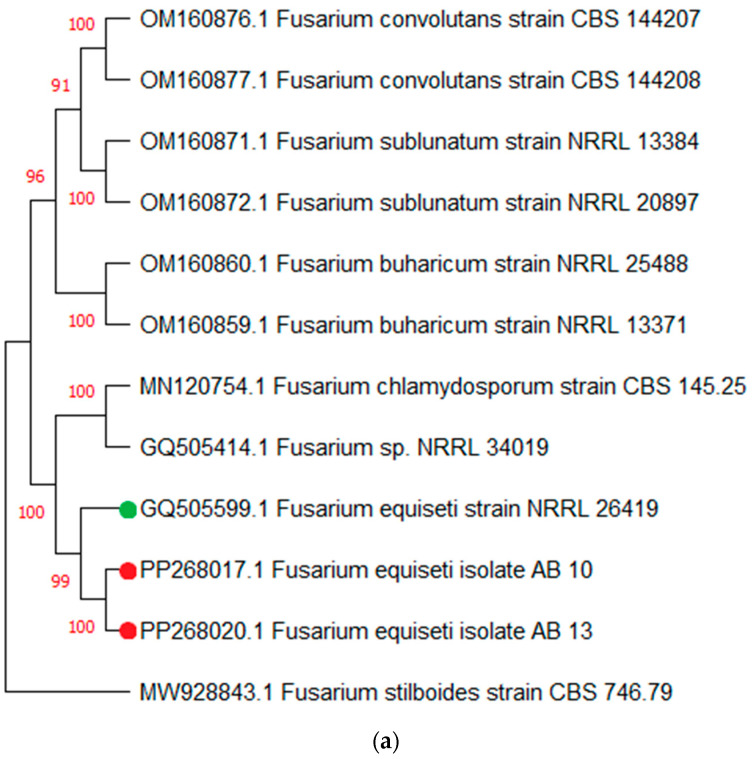
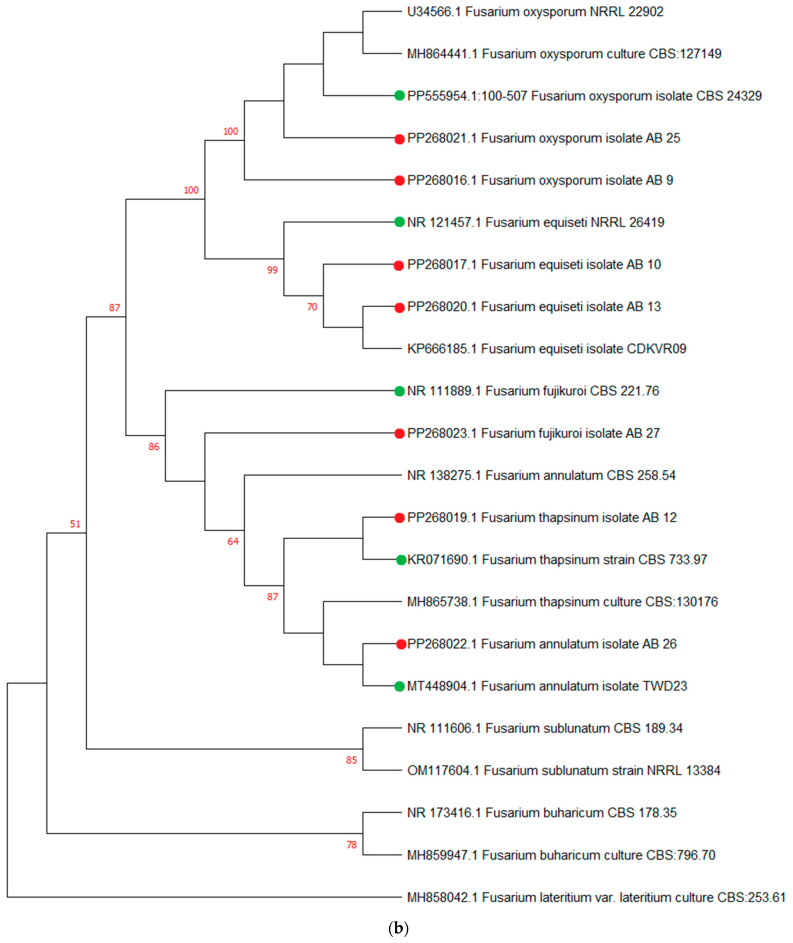
Figure 3.
(a) Phylogenetic tree of partial TEF gene sequences for the evolutionary relationship of isolates by Maximum Likelihood method. Sequences shown in red are isolates from this study. TEF sequence from Fusarium stilboides was used as an outgroup. (b) Phylogenetic tree of partial ITS gene sequences for the evolutionary relationship of isolates by Maximum Likelihood method. Sequences shown in red are isolates from this study. GenBank accession numbers of ITS sequences are followed by the species name from which the sequences originated. ITS sequence from Fusarium lateritium was used as an outgroup. For both trees, red circles indicate isolation from Pakistan and green circles are database-derived sequences.


