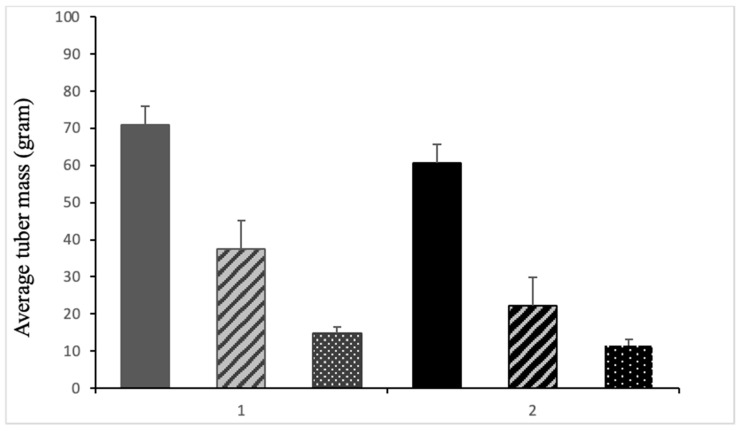
Figure 5.
Series one represents the AGB red variety and series 2 represents the Kuroda variety. Solid bars in both series represent the control plants; the striped bar represents the average tuber mass in grams of plants treated with Fusarium equiseti; and the dotted bar represents the average tuber mass of plants treated with Fusarium oxysporum.

