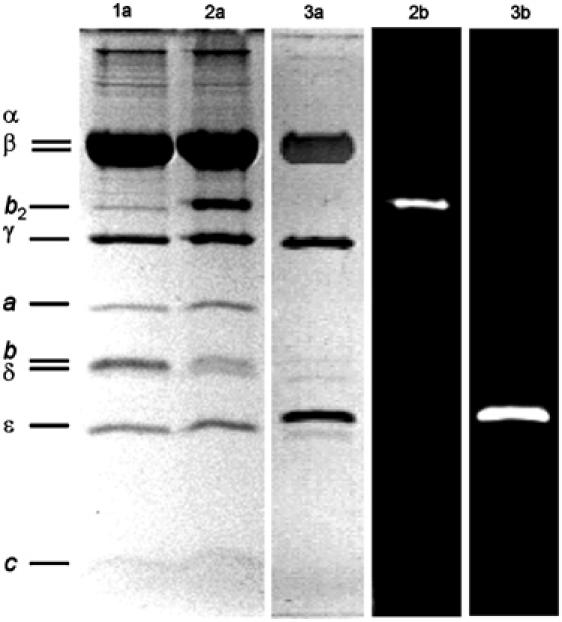
Figure 2.

SDS–PAGE (13%) of F1 and F0F1. Lanes marked with (a) show the protein stained with Coomassie blue and those marked with (b) show the corresponding fluorograms. Lane 1: F0-bQ64C-F1; lane 2: F0-bQ64C-Cy5bis-F1 showing crosslinking of subunits b by Cy5bis; lane 3: F1-ɛH56C-TMR.
