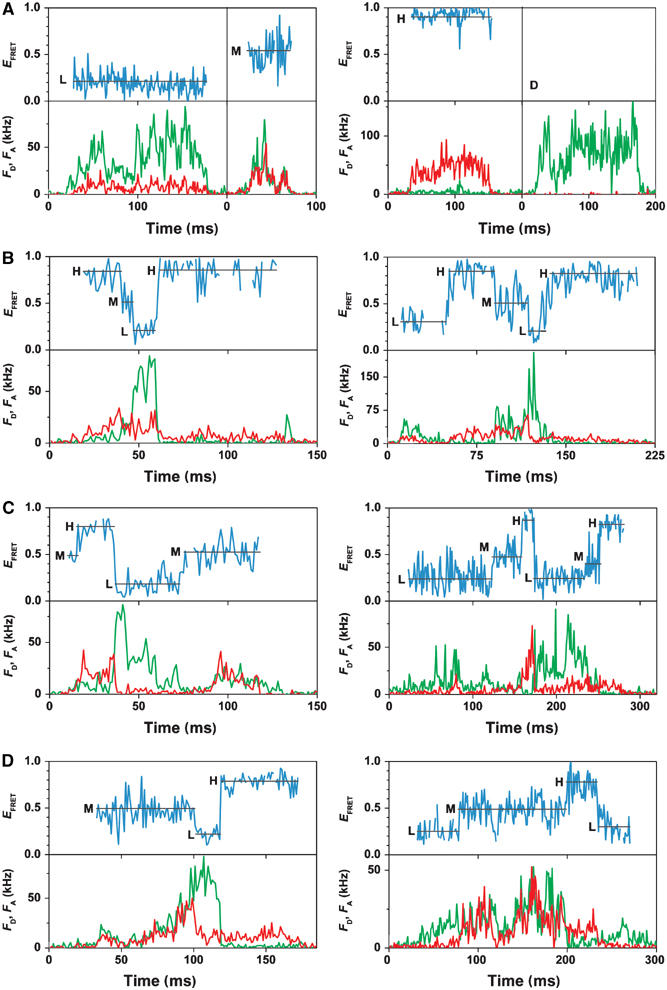
Figure 3.

Photon bursts of FRET-labeled F0F1 in liposomes. Corrected fluorescence intensity traces of the donor, FD, and acceptor, FA, are green and red, respectively. The FRET efficiencies (EFRET) calculated from these traces are shown as blue traces. For each FRET level, the arithmetic mean value is calculated (black line). The three FRET states are labeled L, M, and H. (A) Traces in the presence of AMPPNP showing constant FRET efficiencies and a donor-only-labeled F0F1 in a liposome (D). (B) Traces during ATP hydrolysis showing stepwise changes of FRET levels in the sequence → L → H → M → L. (C) Traces during ATP synthesis showing stepwise changes of FRET levels in the sequence → L → M → H → L. (D) Traces during proton transport showing both sequences.
