
Figure 5.
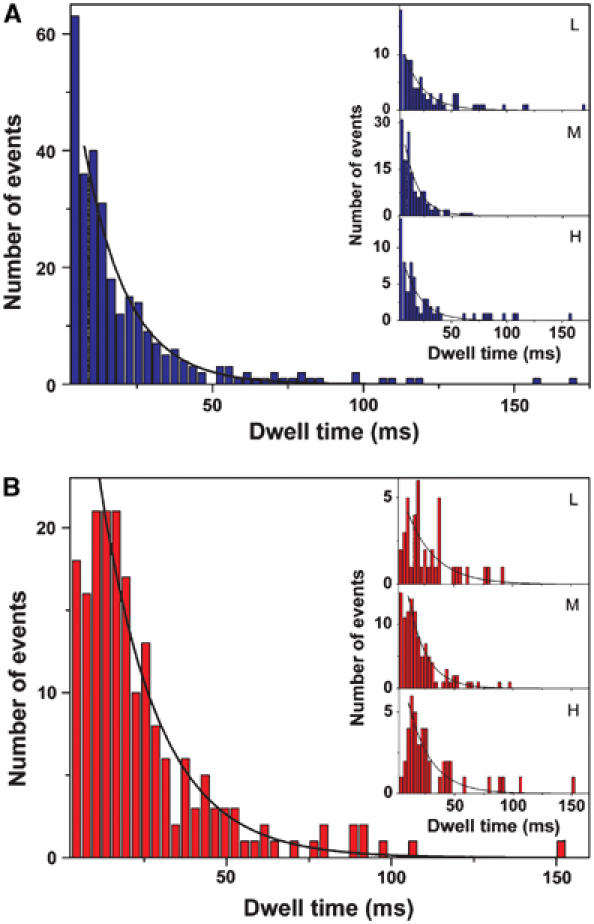
Histograms of dwell times of all FRET levels (A) during ATP hydrolysis (292 dwells) and (B) during ATP synthesis (193 dwells). Monoexponential fits (black lines) yield average dwell times of tH=14.3±0.7 ms (mean±standard deviation of the mean) during ATP hydrolysis and tS=17.7±0.9 ms during ATP synthesis. Monoexponential fits of the dwell times of each FRET level separately (see insets) give t=17.6±1.4 ms (L, 89 dwells), t=12.7±1.0 ms (M, 139 dwells), and t=15.8±1.7 ms (H, 64 dwells) for ATP hydrolysis, and t=24.0±4.4 ms (L, 41 dwells), t=15.4±1.0 ms (M, 108 dwells), and t=19.5±2.2 ms (H, 44 dwells) for ATP synthesis.