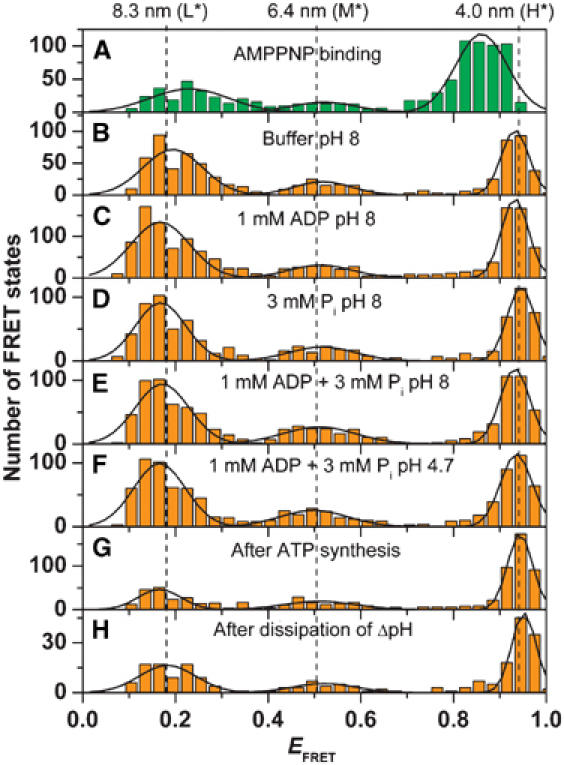
Figure 6.

Histograms of the FRET efficiencies for the inactive F0F1. The mean FRET efficiency was calculated for each observed FRET state and the number of observations was plotted as a function of EFRET. For all conditions, the FRET state remained constant during the burst (see Figure 3A). (A) In the presence of AMPPNP (same data as in Figure 4). (B) Buffer, pH 8 (761 photon bursts). (C) Buffer, pH 8, in the presence of ADP (1428 photon bursts). (D) Buffer, pH 8, in the presence of phosphate (869 photon bursts). (E) Buffer, pH 8, in the presence of ADP and phosphate (960 photon bursts). (F) Buffer, pH 4.7, in the presence of ADP and phosphate (985 photon bursts). (G) 5 min after ATP synthesis (755 photon bursts). (H) 5 min after energization with ΔpH and Δφ (230 photon bursts). The peaks were fitted by Gaussian distributions. For all conditions, the same maxima of the distributions are observed (black lines) except for AMPPNP. The calculated distances are shown at the top.
