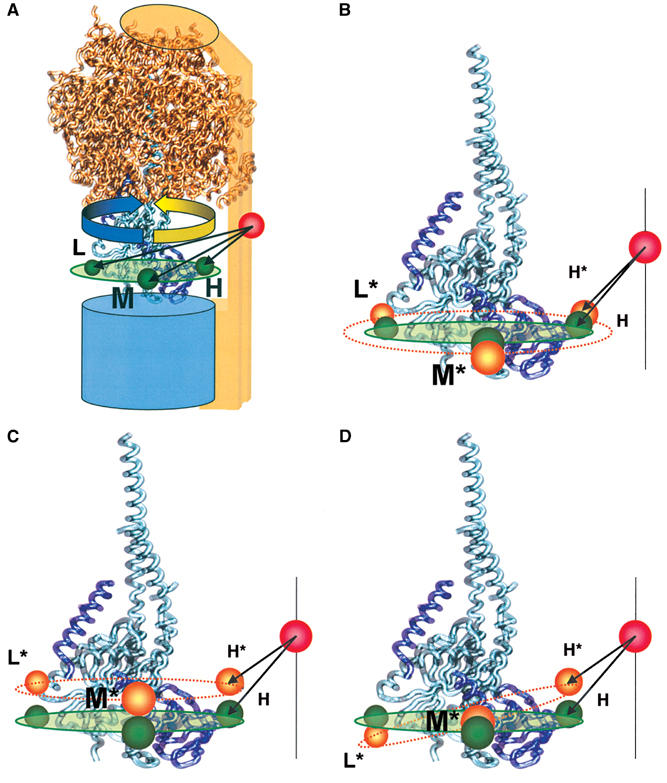
Figure 7.

Visualization of the FRET distances in the F0F1 model. (A) The three donor–acceptor distances calculated from the FRET efficiencies obtained during catalysis are shown in green and labeled H, M, and L. The ATP synthesis direction is shown by an yellow arrow and ATP hydrolysis direction by a blue arrow. (B–D) The three donor–acceptor distances calculated from the FRET efficiencies of the inactive enzyme are shown in orange and labeled H*, M*, and L*, in addition to the active positions in green. The different active–inactive distance changes in the H-, M-, and L-state by the same conformational change in the γɛ-complex. (B) Distance changes by expanding the radius of rotation at ɛ56. (C) Distance change by shifting perpendicular to the membrane plane. (D) Distance changes by tilting with respect to the membrane plane.
