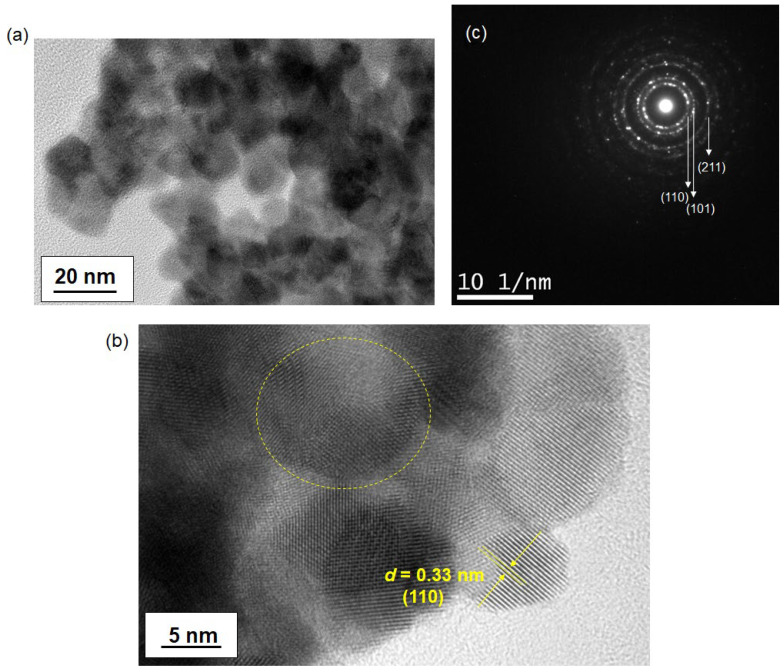
Figure 6.
TEM images of SnO2 nanoparticles sintered at 500 °C. Images (a,b) show the heat-treated nanoparticles at different magnifications. The nanoparticles were synthesized through a 100 °C reaction. In (b), the d-spacing of the lattice fringes of SnO2 is depicted, with the dotted circle highlighting the formation of polycrystalline nanoparticles. Image (c) displays the selected area diffraction (SAD) pattern of the same SnO2 sample.

