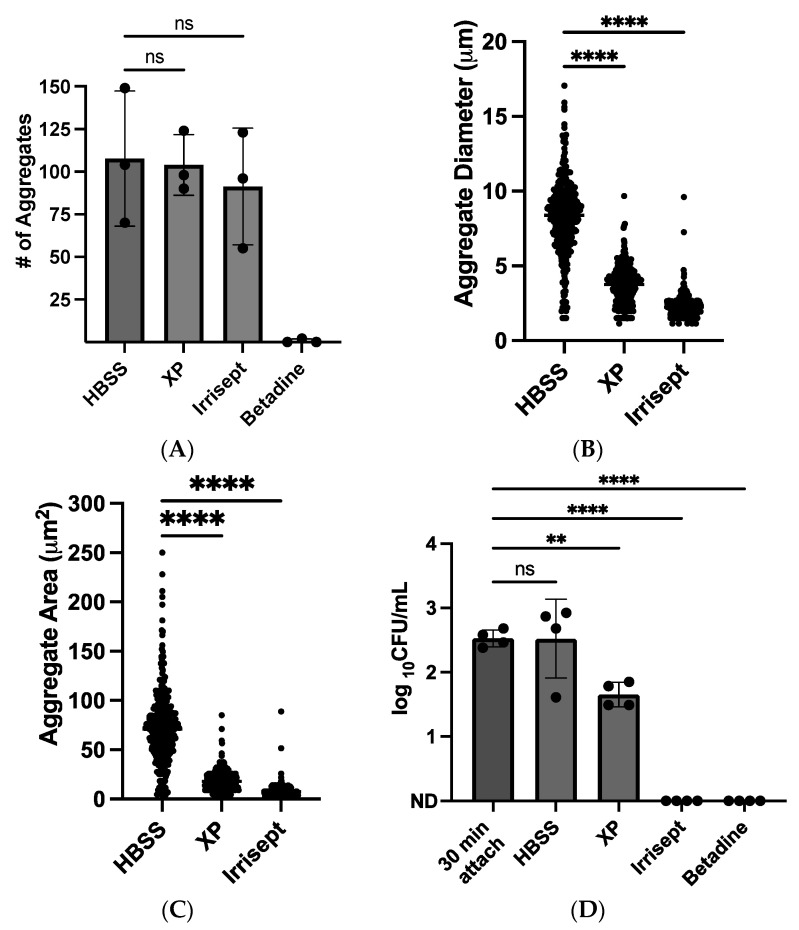
Figure 2.
Direct visualization and quantification of 10% irrigation solution on S. aureus growth. Confocal images were taken 30 min post-attachment and following four-hour growth in the specified condition. Maximum projection z-stack quantification of (A) total aggregates detected (B) aggregate diameter and (C) aggregate area. Data are from three biological replicates. (D) Colony forming units (CFUs) of S. aureus after four-hour growth in solutions. Colonies were manually counted following overnight growth on TSA (ND = not detected). Data displayed are from four separate experiments. ns: not significant ** p < 0.005, **** p < 0.0001 as analyzed by one-way ANOVA followed by Dunnett’s multiple comparisons test. Error bars indicate mean ± SD.

