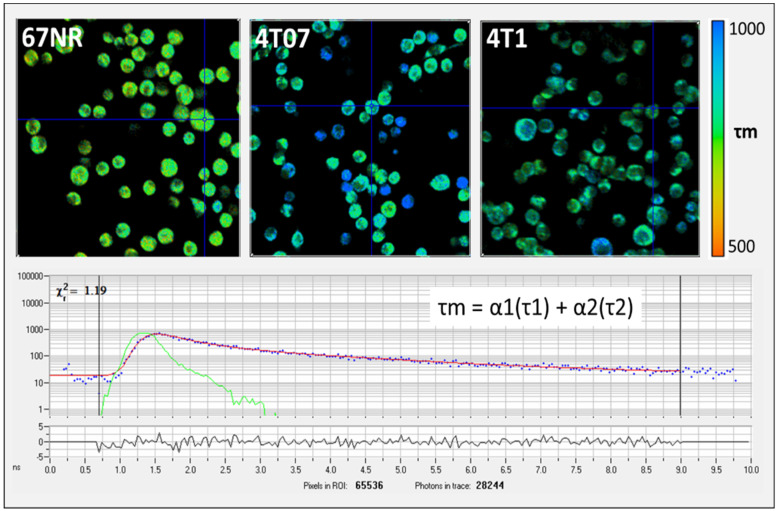
Figure 2.
(Top) Example fluorescence lifetime imaging microscopy (FLIM) images showing mean lifetime (τm) for NAD(P)H from non-metastatic (67NR), metastatically dormant (4T07), and metastatic (4T1) murine breast cancer cells (upper images). Cells were imaged at a 740 nm wavelength with a 450/70 nm filter. The color-coded images in the first row (upper images) show that the 67NR cells have a shorter τm (more yellow in color) compared to the longer τm in 4T07 and 4T1 cells (more blue in color). The cross hairs centered on specific cells in each panel indicate where fluorescence life time measurement is localized. (Bottom) Example photon lifetime distribution from a single pixel location as displayed by the SPCImage software (v8.0). Units are in nanoseconds (ns).

