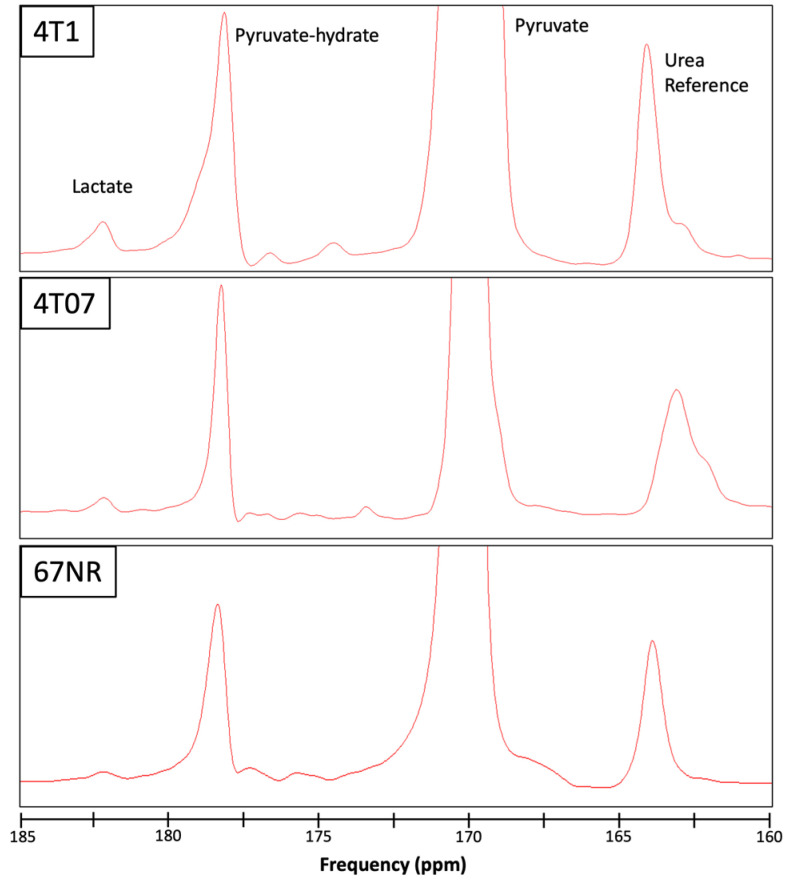
Figure 3.
Representative spectra from the 3 cell lines studied, 4T1 (top), 4T07 (middle), and 67NR (bottom), showing the pyruvate substrate (170 ppm, truncated), pyruvate hydrate (178 ppm) and lactate (182 ppm) components of hyperpolarized [1-13C] pyruvate metabolism. A vial of urea was included adjacent to the bioreactor chamber as a reference (163 ppm) for calibration. Elevated lactate is apparent for the 4T1 (highly metastatic) in contrast to the 4T07 and 67NR (non-metastatic) cell lines. Note that the small peak near the lactate frequency for the 67NR spectra was measured to be below the noise threshold by the jMRUI analysis software (v5.2).

