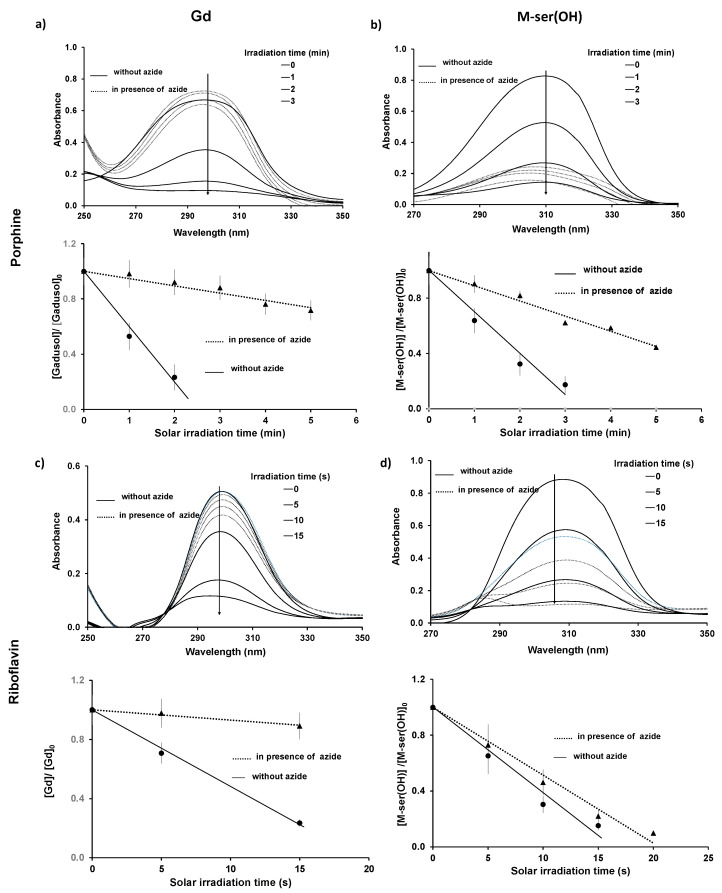
Figure 12.
Time-dependent absorption spectra of gadusolate (1 × 10⁻⁴ mol.L−1 < [Gd]0 < 1.8 × 10⁻⁴ mol.L−1) and M-ser(OH) (4.7 × 10⁻⁵ mol.L−1 < [M-ser(OH)]0 < 1.7 × 10⁻⁴ mol.L−1) after 0, 1, 2 and 3 min of irradiation for porphine (2.0 × 10⁻⁴ mol.L−1) (a,b), and after 0, 5, 10, 15 s of irradiation for riboflavin (4.0 × 10⁻⁵ mol.L−1) (c,d), l = 0.2 cm. The values are presented as mean ± standard deviation, n = 3.

