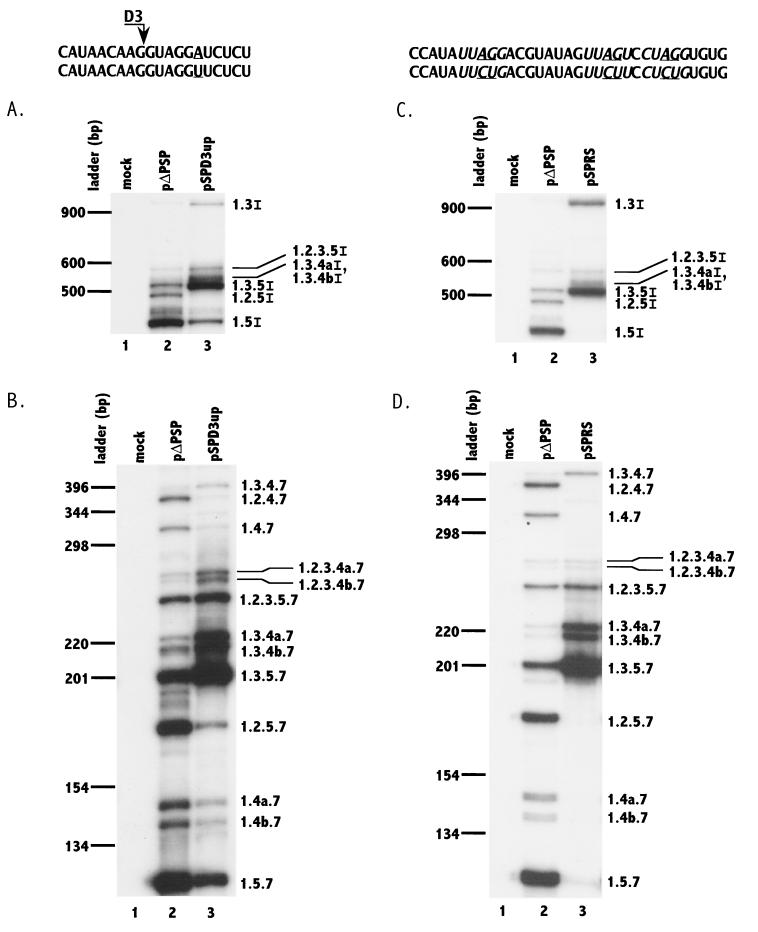
FIG. 2.
Mutagenesis of 5′ splice site D3 toward the consensus 5′ splice site sequence (panels A and B) and putative silencers (panels C and D) increases splicing at 3′ splice site A2 and inclusion of noncoding exon 2. RT-PCR analyses of ∼4.0-kb (A and C) and ∼1.8-kb (B and D) mRNAs from cells transfected with wild-type and mutant plasmids (pΔPSP and pSPD3up in panels A and B; pΔPSP and pSPRS in panels C and D) were performed. Mock-transfected cell mRNA was analyzed in parallel. Denaturing PAGE of 32P-labeled PCR products was performed as described in Materials and Methods. The mutated sequences in each case are shown below the wild-type NL4-3 sequence, and the changes are underlined. The PyUAG sequences are shown in italic type. RNA species are designated with exon numbers (and letters) as in Fig. 1. Note in panels A and C that RNA species 1.3.4aI and 1.3.4bI were not separated. The locations on the gel of DNA ladder bands are shown on the left.

