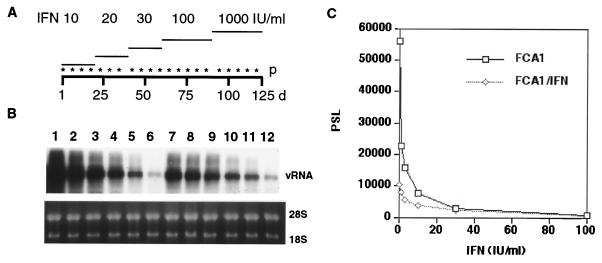
FIG. 6.
Long-term treatment of FCA1 cells with IFN-α. (A) FCA1 cells were incubated for the indicated number of days (d) with increasing doses of IFN-α in the presence of G418 (1 mg/ml). The cells were passaged (p) at a ratio of 1:6 during the incubation with 10 to 30 IU of IFN/ml and at a ratio of 1:10 with 100 and 1,000 IU of IFN/ml at the indicated (asterisks) time points. (B) Control FCA cells (FCA1; lanes 1 to 6) and IFN-treated cells (FCA1/IFN; lanes 7 to 12) were incubated for 6 days without IFN and G418 and then with 0, 1, 3, 10, 30, or 100 IU of IFN-α/ml for 72 h (lanes 1 to 6 and 7 to 12, respectively). Viral RNA (vRNA) levels were determined by Northern blot analysis with a plus strand-specific probe. (C) Levels of viral RNA determined with a phosphorimager in FCA1 (squares) and FCA1/IFN (diamonds) cells treated with the indicated amounts of IFN-α. PSL, arbitrary unit.

