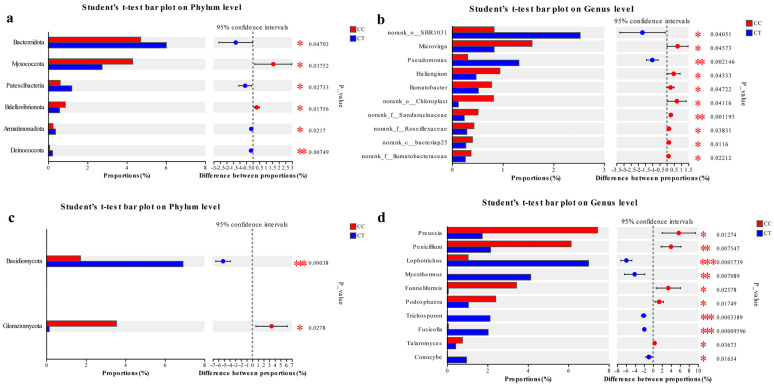
Figure 5.
Difference analysis under CC and CT treatments. (a,b) are differences in bacterial communities at the phylum and genus levels. (c,d) are the differences in fungal communities at the phylum and genus levels. On the right side is the p value. * indicates that there is a significant difference between the two sets of data (p < 0.05), ** indicates that there is a very significant difference between the two sets of data (p < 0.01), *** indicates that there is a highly significant difference between the two sets of data (p < 0.001), using the Student’s t-test.

