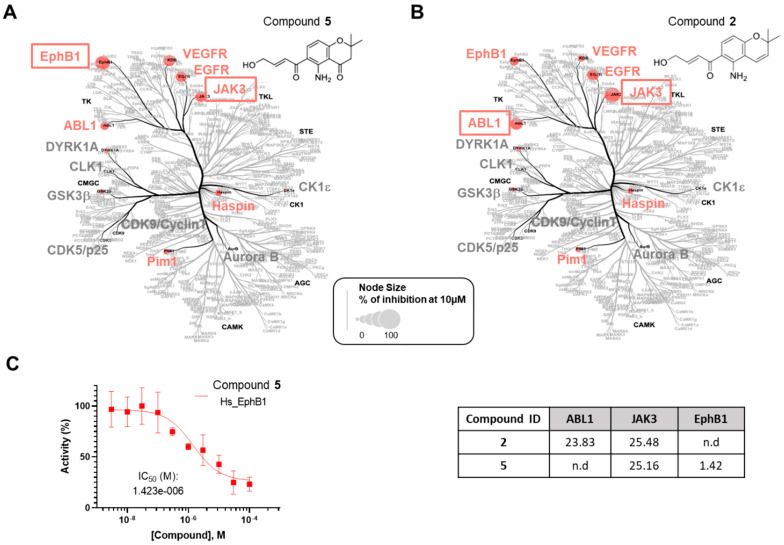
Figure 4.
Selectivity analysis of compounds 2 and 5. The compounds 5 (A) and 2 (B) were tested in a primary screening against a panel of 14 disease-related protein kinases. Only the results obtained for 10 µM are reported on an artistic representation of the human kinome phylogenetic tree. This visualization of the human kinome was generated using Coral [27], a user-friendly web application (web application available at http://phanstiel-lab.med.unc.edu/CORAL/, accessed on 20 July 2024). Quantitative data extracted from Table S1 were encoded in node size as mentioned in the legend of the figure. The codes reported in black on this figure indicate the subclasses of protein kinases: CMGC for CDKs, MAP kinases, and GSK and CDK-like kinases; AGC for protein kinase A, G, and C families (PKA, PKC, PKG); CAMK for Ca2+/calmodulin-dependent protein kinases; CK1, casein kinase 1; STE, STE kinases (homologs of yeast STErile kinases); TKL, tyrosine kinase-like; TK, tyrosine kinases. Each kinase tested in the assay panel is written in large font; kinases colored in gray are not affected by the tested compound and kinases colored in red (“hit kinases”) are inhibited by the tested compounds. (C) IC50 (µM) for compounds 2 and 5 against the selected protein kinases. Only the curve showing the inhibition of EphB1 tyrosine kinase by compound 5 is depicted in the figure. Kinase activities reported on the graph are expressed in % of maximal activity, i.e., measured in the absence of compound 5.

