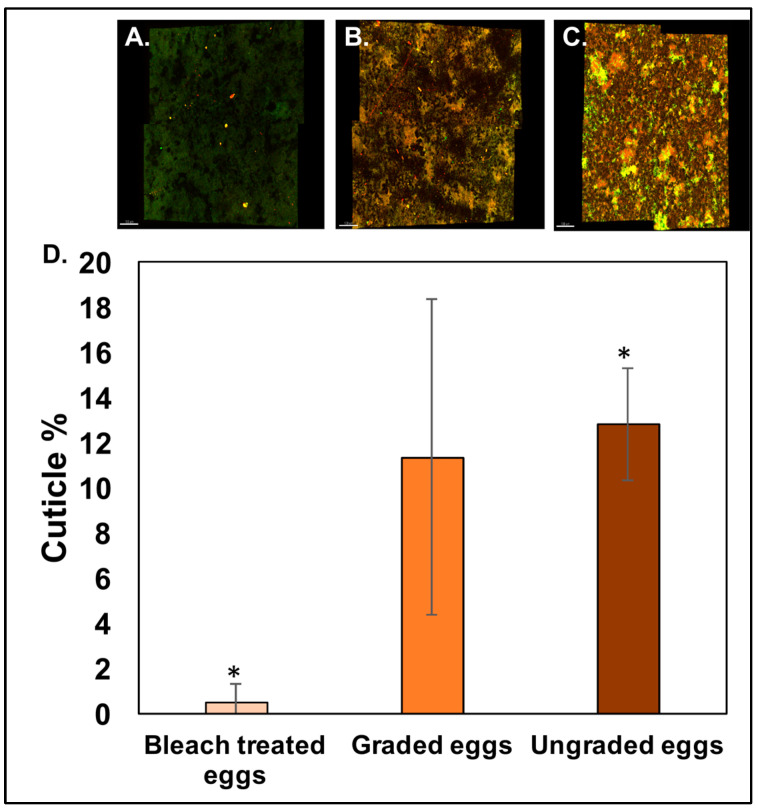
Figure 3.
Quantification of cuticle proteins on the eggshell surface. Confocal fluorescent micrographs showing fluorescent cuticle proteins on the outer surface of (A) bleach-treated eggs, (B) graded eggs, and (C) ungraded eggs. (D) The impact of egg washing on the percentage (%) cuticle coverage on the outer surface of eggshells displays a lesser coverage in the shells from bleach-treated eggs as compared to the eggshells of ungraded eggs. The significant differences between bleach-treated vs ungraded eggs are represented by (*). Values are represented as mean ± standard deviation (n = 3 × 4 = 12, one-way ANOVA; p < 0.05).

