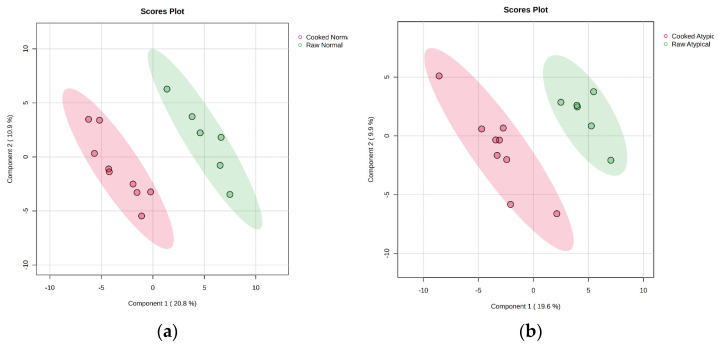
Figure 2.
Projections to latent-discriminant analysis plot (PLS-DA) of the metabolites present in (a) raw normal longissimus lumborum at the beginning of retail display and normal longissimus lumborum following 5 d of retail display and cooking to 71 °C and (b) raw atypical dark-cutting longissimus lumborum at the beginning of retail display and atypical dark-cutting longissimus lumborum following 5 d of retail display and cooking to 71 °C. Red color in both figures corresponds to the respective cooked product, while green indicates raw.

