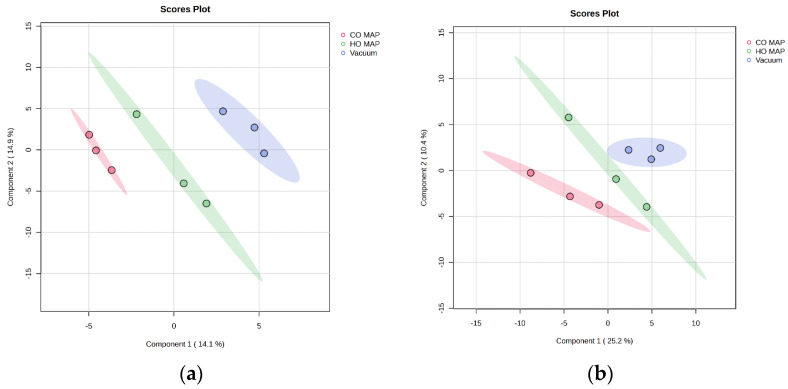
Figure 3.
Projections to latent-discriminant analysis plot (PLS-DA) of the metabolites present in cooked (a) atypical dark-cutting beef and (b) normal in different packaging. The red color in both plots corresponds to CO-MAP packaged steaks, green corresponds to HO-MAP (high-oxygen MAP), and blue denotes vacuum packaged steaks.

