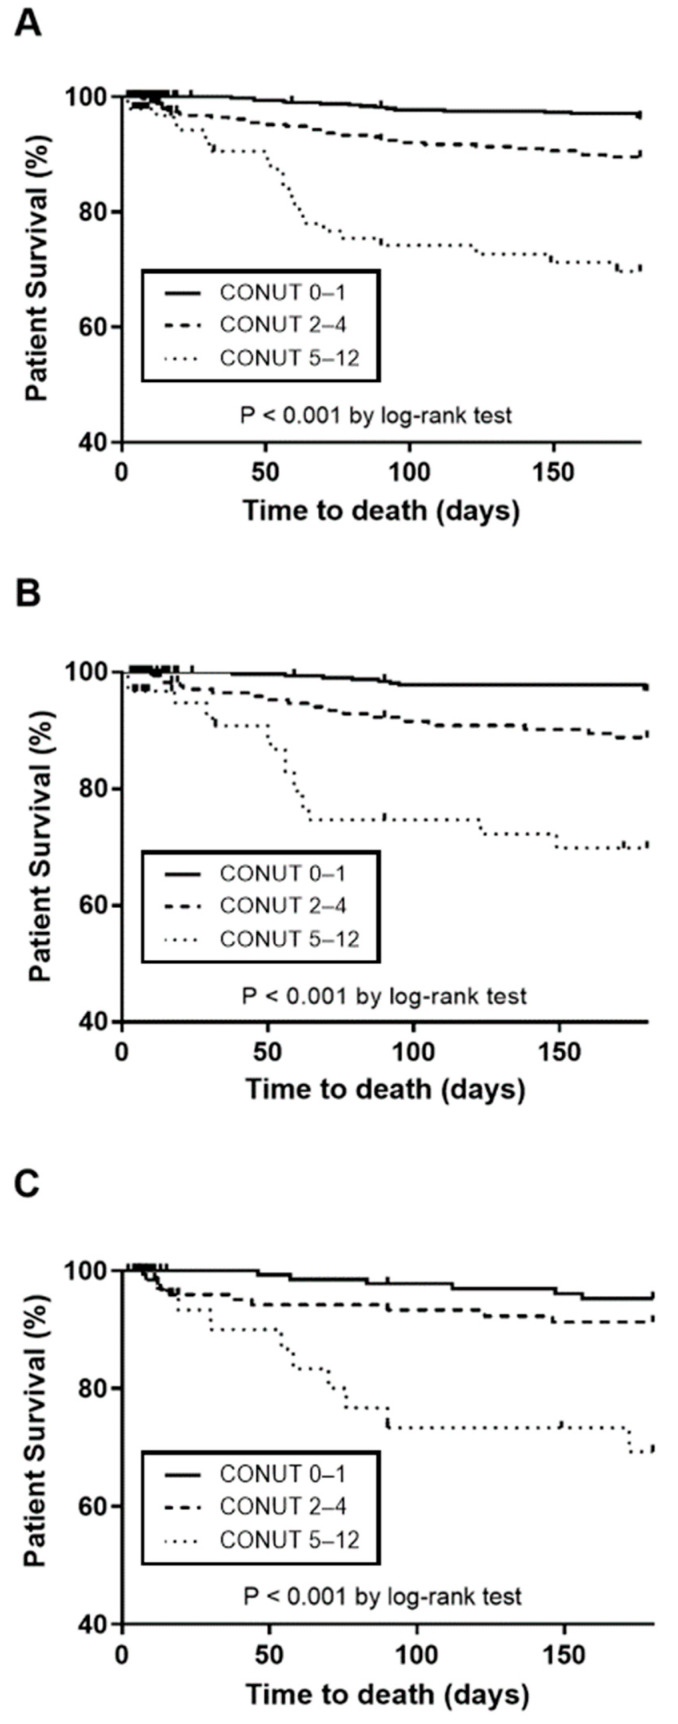
Figure 3.
Comparison of Kaplan–Meier survival curves among different patient groups. (A) All patients; (B) patients with mild stroke; and (C) patients with moderate/severe stroke. The analysis was adjusted for confounders, including age, sex, NIHSS score, hypertension, diabetes mellitus, coronary heart disease, atrial fibrillation, hyperlipidemia, smoking, alcohol consumption, heart, renal, liver, or malignant diseases. CONUT, Controlling Nutritional Status.

