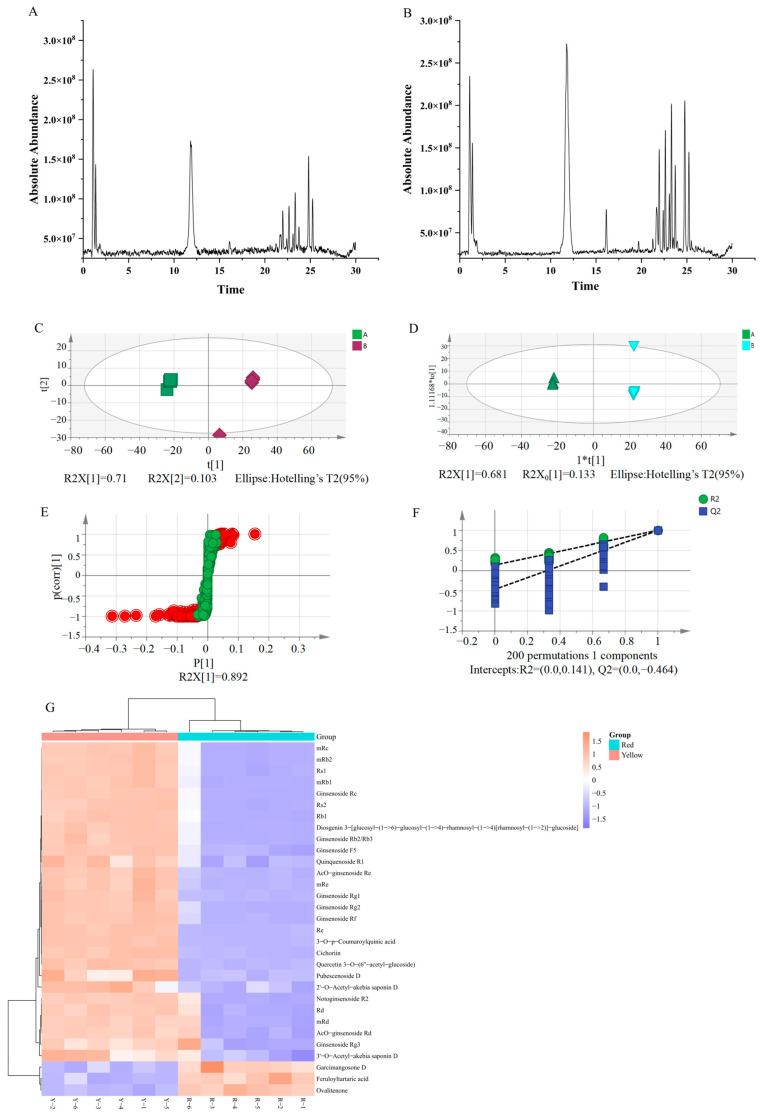
Figure 1.
Chemical composition of RGB and YGB based on UHPLC-Q-Exactive-MS combined with multivariate statistical analysis. (A) TIC of RGB. (B) TIC of YGB. (C) PCA score plots. (D) OPLS-DA score plots. (E) S-plot score plots. (F) Permutation test chart. (G) Heat map analysis of RGB and YGB. Note: The total ion chromatograms (TIC); principal components analysis (PCA); orthogonal partial least squares discriminant analysis (OPLS-DA)

