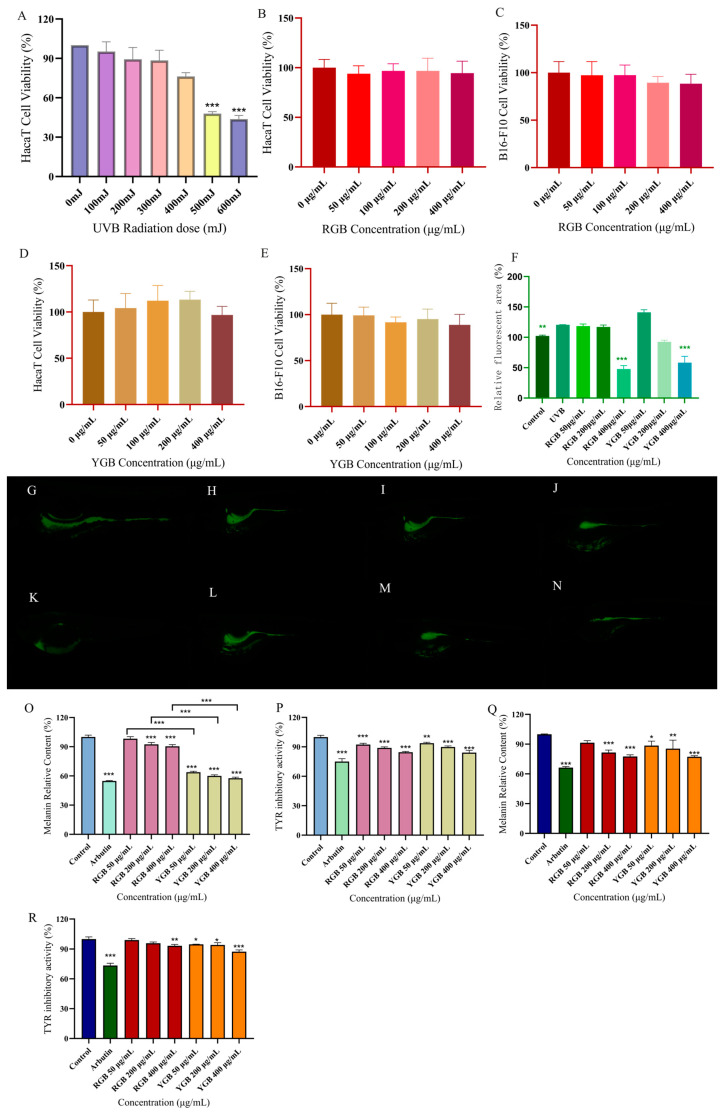
Figure 4.
Comparing the anti-aging and whitening effects of ginseng berries of different fruit colors. (A) UVB radiation dose to HaCaT cells. (B) Red berries HaCaT cytotoxicity assay. (C) Red berries B16-F10 cytotoxicity assay. (D) Yellow berries HaCaT cytotoxicity assay. (E) Yellow berries B16-F10 cytotoxicity assay. (F) Statistical analysis of RGB and YGB fluorescence areas. (G) Control group. (H) UVB group. (I) 50 μg/mL RGB. (J) 200 μg/mL RGB. (K) 400 μg/mL RGB. (L) 50 μg/mL YGB. (M) 200 μg/mL YGB. (N) 400 μg/mL YGB. (O) Relative melanin content in B16-F10 cells. (P) Relative tyrosinase content in B16-F10 cells. (Q) Relative melanin content in zebrafish (R) Relative tyrosinase content in zebrafish. Note: * p < 0.05; ** p < 0.01; *** p < 0.001. DCFH-DA Reactive Oxygen ROS Fluorescent Probe (2′,7′-Dichlorodihydrofluorescein Diacetate).

