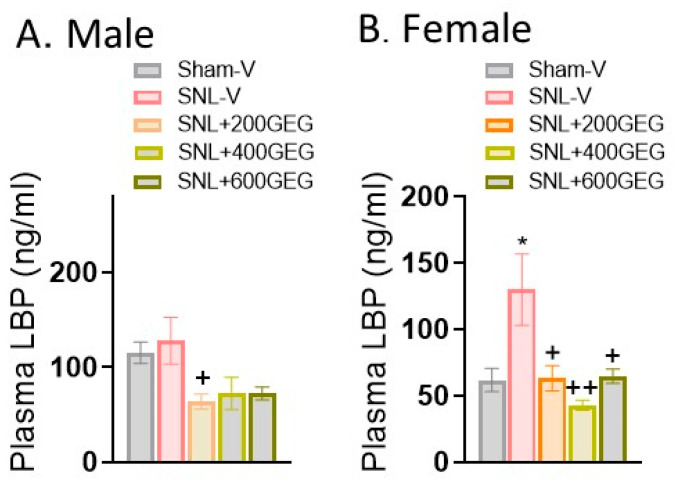
Figure 3.
Effects of GEG on plasma LBP in the male rats (A) and female rats (B) assessed by ELISA. Data are expressed as mean ± SEM and were analyzed by one-way ANOVA followed by Bonferroni multiple comparisons test. n = 4–6 per group. * p < 0.05 compared with Sham-V group. + p < 0.05, ++ p < 0.01 compared with SNL-V group.

