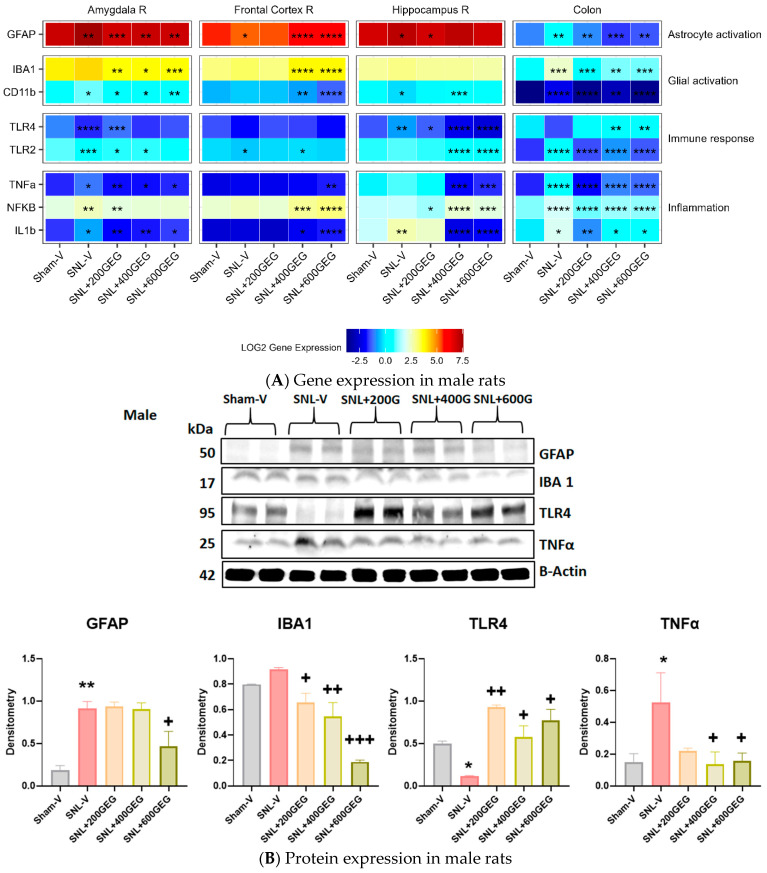
Figure 5.
Effects of GEG on the neuroinflammation-associated gene expression levels in amygdala, frontal cortex, hippocampus, and colon of male rats (A) and protein expression levels in colon of male rats (B). For gene expression, data are expressed as mean ± SEM and were analyzed by one-way ANOVA followed by Tukey’s test, n = 7–9 per group. * p < 0.05, ** p < 0.01, *** p < 0.001, **** p < 0.0001 for SNL-V vs. Sham-V group, and other groups vs. SNL-V group. For protein expression, data are expressed as mean ± SEM and were analyzed by one-way ANOVA followed by Tukey’s multiple comparisons test, n = 7–9 per group. * p < 0.05, ** p < 0.01 compared with Sham-V group. + p < 0.05, ++ p < 0.01, +++ p < 0.001 compared with SNL-V group.

