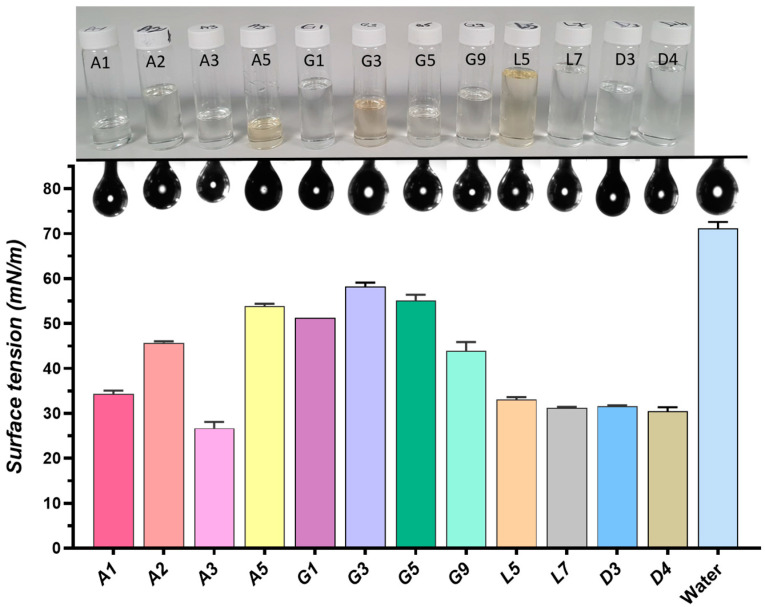
Figure 4.
Surface tension variation of different DESs systems, measured in mN/m. The bar graph shows the surface tension values for each DESs system, while the images above the bars represent the pendant drops measured during goniometric analysis. The vials displayed above correspond to each DESss system, illustrating their appearance in liquid form.

