Figure 2.
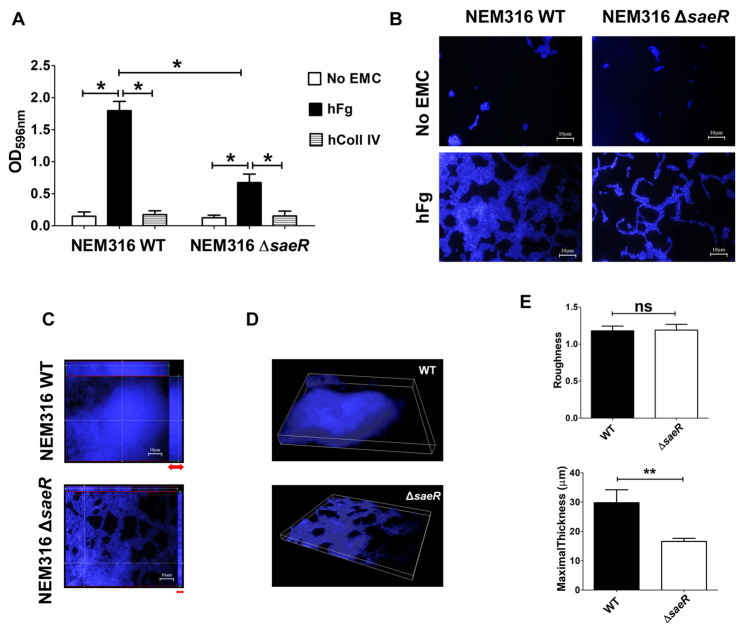
SaeR regulates GBS biofilm formation over human fibrinogen. (A) Biofilm formation abilities of NEM316 wild-type (WT) and NEM316 deleted for saeR (ΔsaeR) strains on twelve-well plates coated with human fibrinogen (hFg) and human collagen type IV (hColl IV) or without any extracellular matrix components (no EMCs). GBS growth as biofilm was analyzed at 48 h and verified with CV staining. Bacterial biomass was quantified by measuring the optical density at 596 nm (OD596nm). Results are means ± SD from three independent experiments performed in triplicate. * p < 0.05, as determined by Mann–Whitney statistical analysis. (B) Morphological differences among GBS biofilms on hFg. WT and ΔsaeR biofilms on hFg or uncoated wells (no EMCs) were visualized with 4′,6-diamidino-2-phenylindole (DAPI, blue). Shown are representative images of three independent experiments. Scale bar = 10 µm. (C) Assembly of bacteria in biofilm formed on hFg. Z-stack sections of 48-h-old GBS biofilms on hFg, with orthogonal views from x/z and y/z planes showing the distribution of bacterial genome stained with 4′,6-diamidino-2-phenylindole (DAPI, blue). Differences in biofilm height are indicated with red arrows. Shown are representative images of three independent experiments. Scale bar = 10 µm. (D) Three-dimensional reconstruction representative of hFg-biofilms formed by WT and ΔsaeR mutant GBS strains after 48 h. Bacteria were stained with 4′,6-diamidino-2-phenylindole (DAPI, blue); (E) COMSTAT-2 quantification of maximal thickness (µm) and dimensionless roughness coefficient in biofilms formed on hFg at 48 h by WT and ΔsaeR strains. ns, not significant; ** p < 0.01, as determined by Mann–Whitney statistical analysis. Data are from five different independent experiments.

