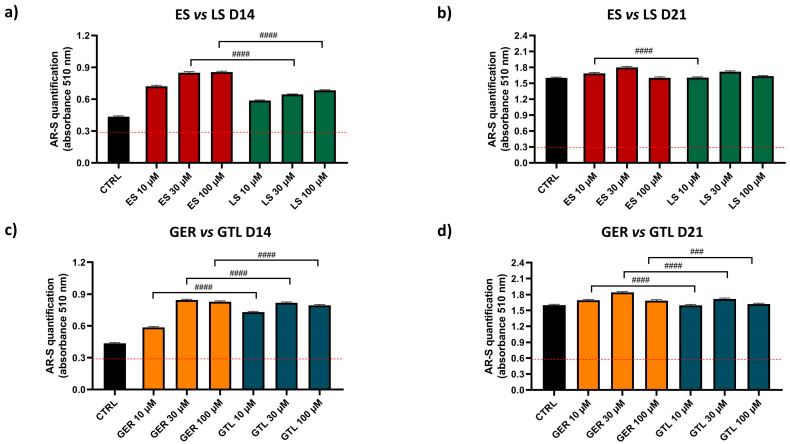
Figure 5.
AR-S on ES-, GER-, LS-, and GTL-treated cells vs. CTRL cells during osteogenic stimulation. Panels (a–d) show histograms (mean ± SEM) of AR-S quantification obtained by 177 measurements in duplicate for each of the N = 8 donors comparing (a) ES (red) vs. LS (green) D14; (b) ES vs. LS D21; (c) GER (orange) vs. GTL (blue) (D14); (d) GER vs. GTL (D21). Friedman–Dunn’s multiple-comparisons test: #: Comparisons between different treatments at the same concentration (es 10 μM ES vs. 10 μM GER). #### p < 0.0001. ES and LS extract concentrations are expressed as GER and GTL content (μM), respectively.

