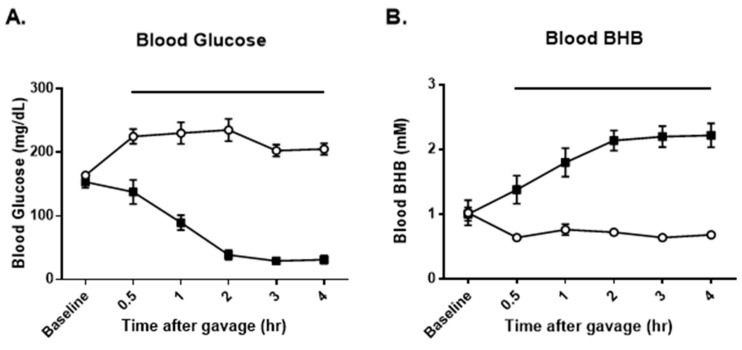
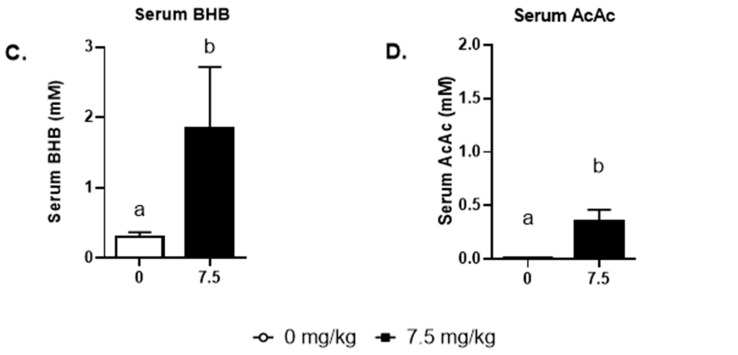
Figure 5.
Experiment 3: Mice were fasted from 2 h before gavage to 4 h after gavage. (A) The average of each group’s blood glucose in mg/dL at each timepoint. (B) The average of each group’s blood BHB in mM at each timepoint. (C) Serum BHB at 4 h as determined by LCMS. p < 0.005. LCMS quantifies both enantiomers of BHB. (D) Serum AcAc at 4 h as determined by LCMS. p < 0.05. Groups of data points with shared alphabetic symbols are not significantly different.


