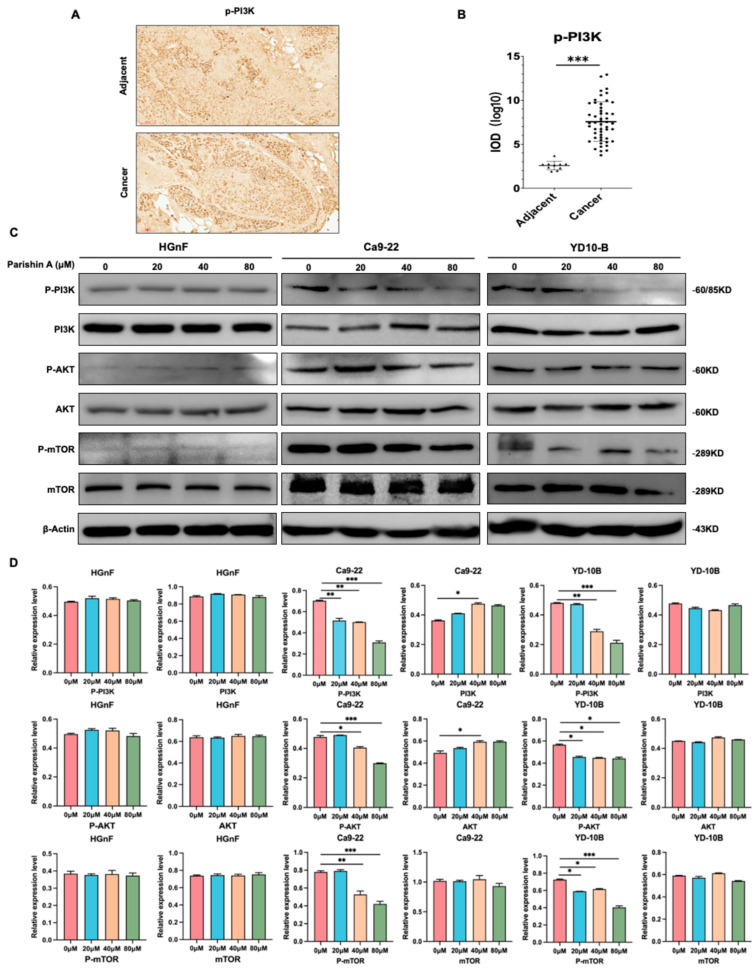
Figure 5.
Parishin A inhibits OSCC via the PI3K/AKT/mTOR signaling pathway. (A) Expression of p-PI3K in OSCC tissues versus adjacent normal tissues, examined by IHC (100× magnification). (B) Quantification of pPI3K expression in OSCC tissues versus adjacent normal tissues. (C) Western blot analysis showing the levels of PI3K, pPI3K, AKT, pAKT, mTOR, and pmTOR in HGnF and OSCC cells treated with Parishin A. (D) Quantification of the protein expression levels of Western blot for different markers. Data are shown as means ± standard deviation of values from three independent experiments each with triplicate samples. * p < 0.05, ** p < 0.01, and *** p < 0.001 compared with 0 μM.

