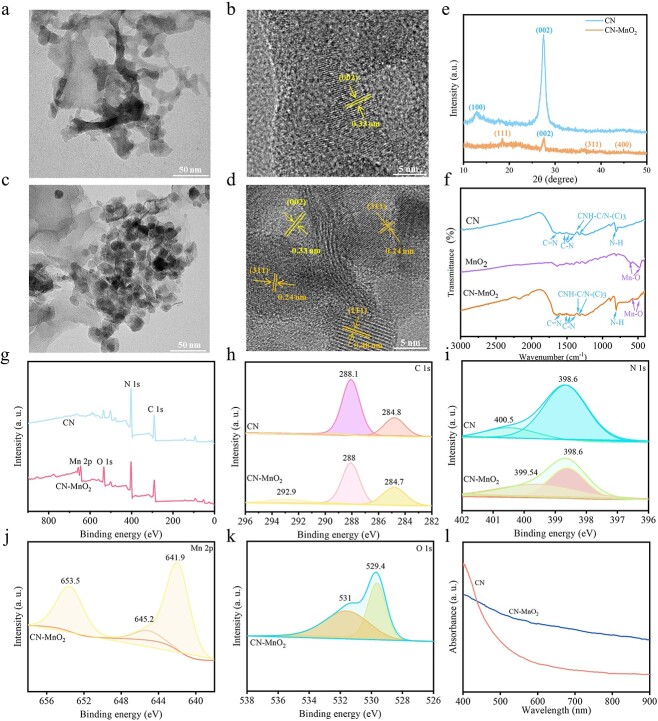
Figure 1.
TEM and HR-TEM images of (a, b) CN and (c, d) CN-MnO2 nanosheets. Scale bars: 50 and 5 nm as indicated. (e) XRD pattern of CN and CN-MnO2; (f) FTIR spectra of CN, MnO2, and CN-MnO2. (g) XPS full spectra of CN and CN-MnO2; high-resolution XPS spectra of (h) C 1 s, (i) N 1 s, (j) Mn 2p, and (k) O 1 s; and (l) UV–Vis–NIR adsorption spectra of CN-MnO2 and CN. TEM transmission electron microscope, HR-TEM high-resolution transmission electron microscope, MnO2 manganese dioxide, XRD X-ray Diffraction, FTIR Fourier Transform Infrared Spectrometer, XPS X-ray photoelectron spectroscopy, UV-vis-NIR Ultraviolet-visible spectroscopy-near-infrared, CN graphitic phase carbon nitride

