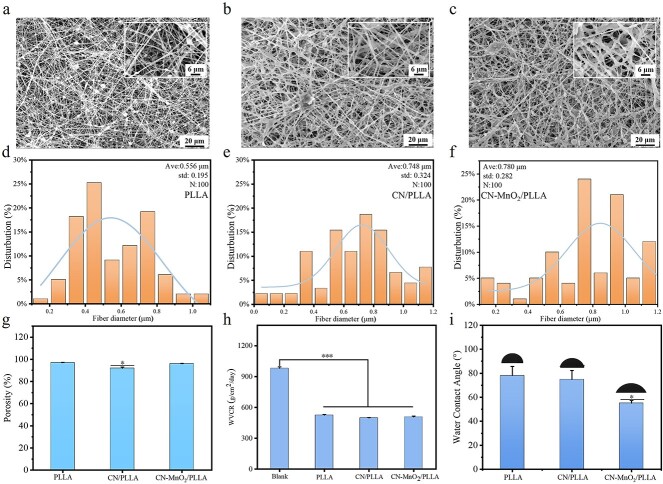
Figure 2.
SEM images of the (a) PLLA, (b) CN/PLLA, and (c) CN-MnO2/PLLA dressings. Scale bars: 6 and 20 μm as indicated. The fiber diameter distribution of the PLLA (d), CN/PLLA (e), and CN-MnO2/PLLA (f) dressings determined from SEM images (n = 100). (g) Porosity, (h) water vapor transmission rate, (i) and water contact angle (inserts images is the represent picture of water contact angle) of the different dressings. The significant difference represent *p < 0.05, ***p < 0.001 compare with PLLA. SEM scanning electron microscopy, Ave average, std standard deviation, PLLA poly-L-lactic acid, CN graphitic phase carbon nitride, MnO2 manganese dioxide

