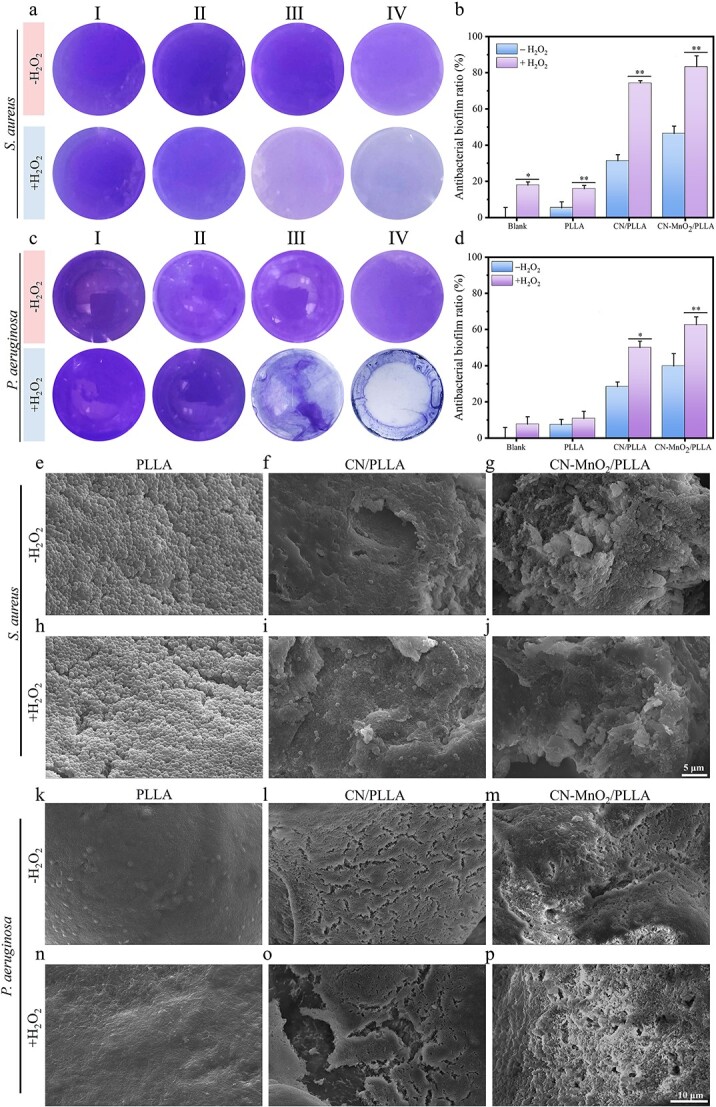
Figure 5.

Representative biofilm staining images of (a) S. aureus and (c) P. aeruginosa with or without H2O2 for 30 min under dual-light (660 nm VL + 808 nm NIR) irradiation. The corresponding antibacterial biofilm ratio of (b) S. Aureus and (d) P. Aeruginosa. I, II, III, and IV represent the four groups of blank, PLLA, CN/PLLA, and CN-MnO2/PLLA, respectively. Images of biofilm morphology of S. aureus on the PLLA (e, h), CN/PLLA (f, i), and CN-MnO2/PLLA (g, j) with or without H2O2. Scale bar: 5 μm. Images of biofilm morphology of P. aeruginosa on the PLLA (k, n), CN/PLLA (l, o), and CN-MnO2/PLLA (m, p) with or without H2O2. The significant difference represent *p < 0.05, **p < 0.01 compare with without H2O2. Scale bar: 10 μm. S. aureus staphylococcus aureus, P. aeruginosa pseudomonas aeruginosa, H2O2 hydrogen peroxide, VL visible light, NIR near-infrared, PLLA poly-L-lactic acid, CN graphitic phase carbon nitride, MnO2 manganese dioxide
