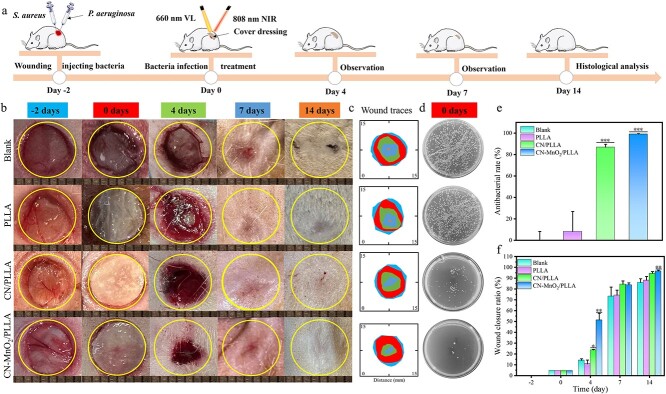
Figure 9.
Detection of infectious wound healing rate in vivo. (a) Schematic diagram illustrating the timeline of the model fabrication of infectious skin wounds caused by S. aureus and P. aeruginosa, and experimental procedures. (b) Wound images (scale bar: 8 mm), (c) wound traces, and (d) bacterial colonies in the infectious skin wounds after implantation with different groups (blank, PLLA, CN/PLLA, and CN-MnO2/PLLA) for 4, 7, and 14 days under NIR light irradiation. (e) Antibacterial rate in vivo on Day 0 of different groups (blank, PLLA, CN/PLLA, and CN-MnO2/PLLA). (f) Wound closure rates of different groups (blank, PLLA, CN/PLLA, and CN-MnO2/PLLA) at Days −2, 0, 4, 7, and 14 were quantitatively analyzed. The significant difference represent *p < 0.05, **p < 0.01, ***p < 0.001 compare with blank. S. aureus staphylococcus aureus, P. aeruginosa pseudomonas aeruginosa, VL visible light, NIR near-infrared, PLLA poly-L-lactic acid, CN graphitic phase carbon nitride, MnO2 manganese dioxide

