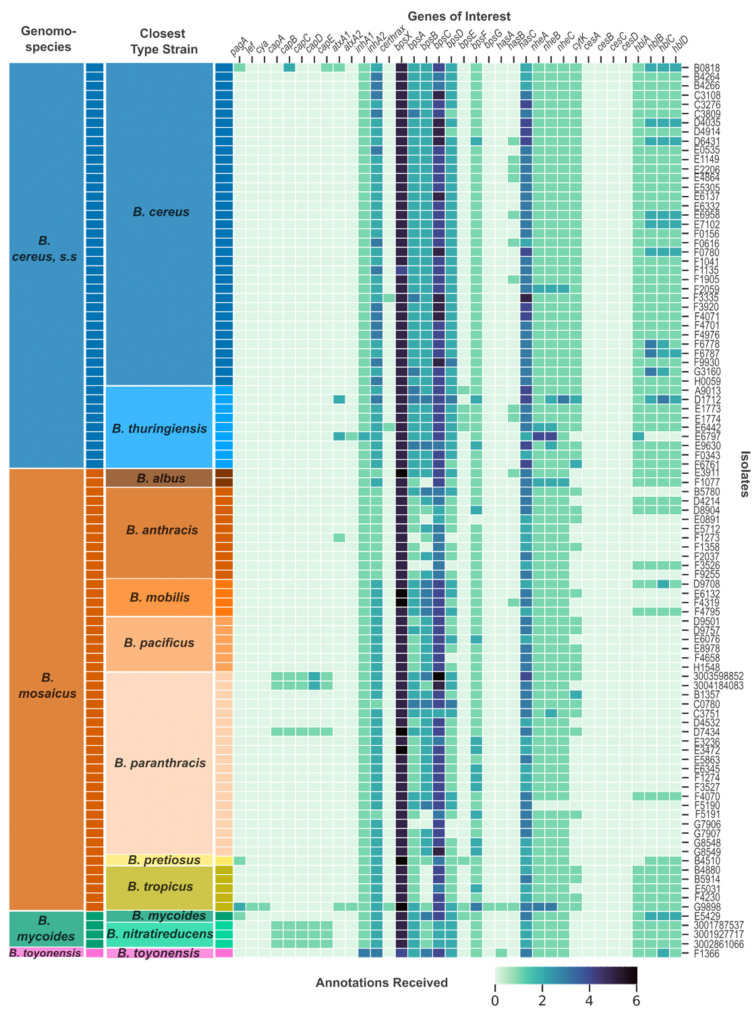
Figure 1.
Presence and number of annotations received by virulence genes across the Bacillus cereus group. Each row represents a unique isolate genome, and each column represents a virulence-related gene from the Bacillus cereus group (BCG). The darkness of each cell represents the number of annotations that an isolate’s genomic assembly received for the corresponding gene from Prokka. The two columns on the left side of the heatmap represent the closest species type strain to that isolate as determined by ANI and dDDH (“Closest Type Strain” column) and the genomospecies to which that type strain belongs according to the 2020 genomospecies organization of the BCG (“Genomospecies” column). The genomospecies are colored differently and labeled in the “Genomospecies” column. The closest type strains are colored in different hues similar to their corresponding genomospecies color and labeled in the “Closest Type Strain” column.

